In the competitive landscape of digital optimization, a common but devastating scenario unfolds within product and marketing teams: a textbook A/B test is executed with rigorous adherence to "no-peeking" rules, yet it yields no statistically significant result. The variation is discarded, and the control version is maintained. However, beneath the surface of the inconclusive data, the variation may have actually possessed a 3% lift—a margin that would have translated into millions in annual revenue had the experiment been sensitive enough to detect it. This sensitivity is defined in data science as statistical power, and its neglect is increasingly recognized by industry experts as a primary cause of stalled growth and contaminated data repositories.
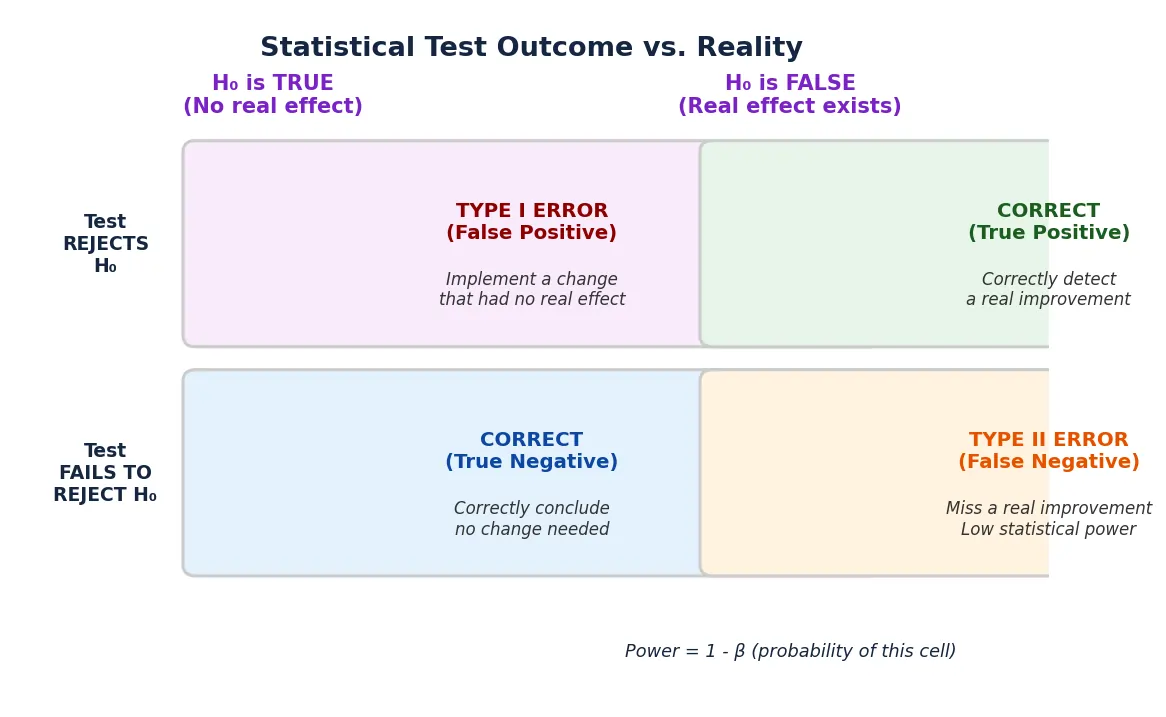
Statistical power represents the probability that an experiment will detect a true effect of a specific size when that effect actually exists. While much of the industry’s focus remains on statistical significance—the protection against "false positives"—power serves as the critical safeguard against "false negatives," or Type II errors. In a professional testing environment, power is not a retrospective observation but a pre-launch lever that dictates the required traffic, duration, and reliability of the entire experimental roadmap.

The Mathematical Framework: Power as the Inverse of Risk
At its technical core, statistical power is expressed as 1 minus beta (1 – β), where beta represents the probability of committing a Type II error (failing to reject a false null hypothesis). The industry standard for power is typically set at 80%. This implies that if a variation truly improves conversions by the anticipated amount, the test has an 80% chance of successfully flagging it as a winner and a 20% chance of missing it entirely.
The distinction between power and significance is fundamental to data integrity. Significance (alpha) controls the threshold of evidence required to declare a winner, effectively limiting the "noise" that might be mistaken for a "signal." Power, conversely, ensures the "signal" is loud enough to be heard over the "noise." A test can be statistically rigorous regarding its significance level yet remain functionally useless if it lacks the power to identify meaningful changes. This discrepancy often leads to the "silent killer" of optimization programs: the abandonment of winning ideas because the experimental tool was not sufficiently calibrated.
The Four Pillars of Experimental Sensitivity
The determination of whether an A/B test possesses adequate power depends on the dynamic interplay of four primary factors. Adjusting any one of these variables necessitates a recalibration of the others to maintain experimental balance.

1. Sample Size (N)
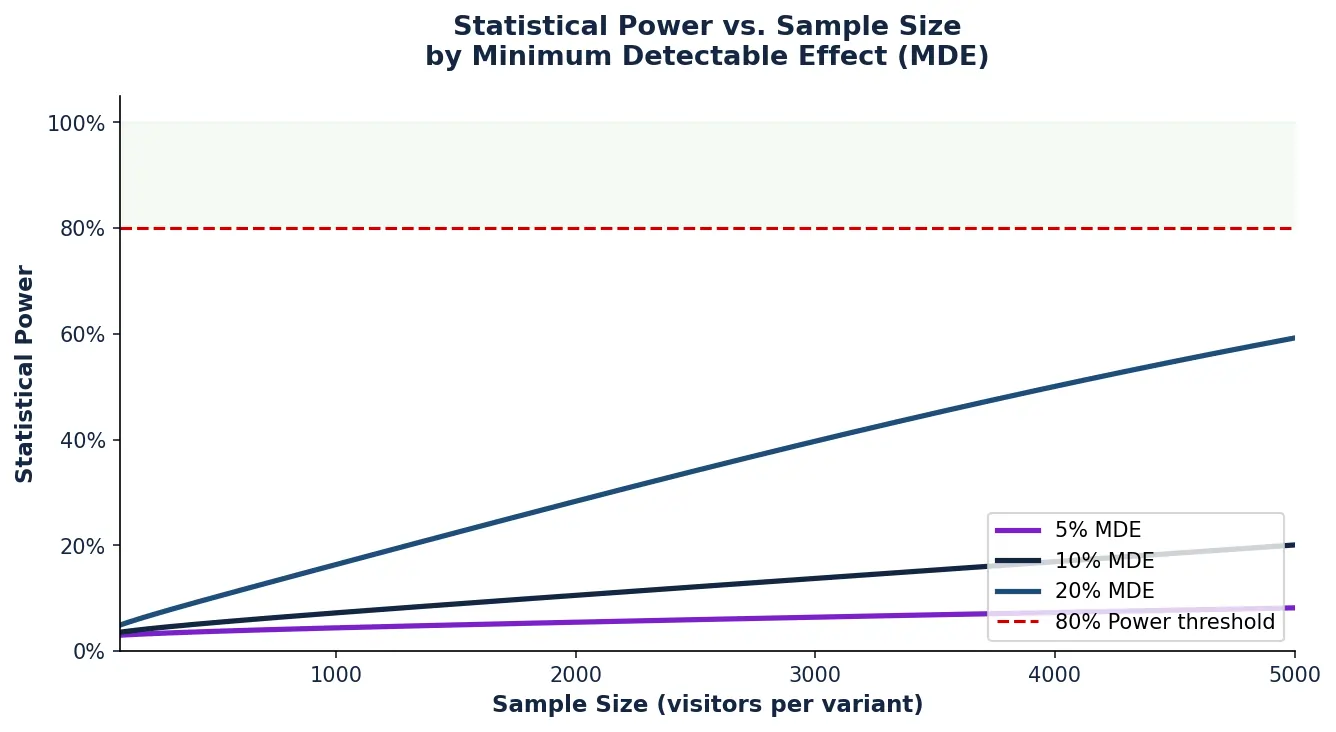
The most direct driver of power is the volume of independent randomized units, typically unique visitors. As the sample size increases, the "sampling distribution" narrows, making it easier to distinguish between random fluctuations and true performance shifts. In low-traffic environments, even substantial improvements can be obscured by daily variance, leading to underpowered results.
2. Minimum Detectable Effect (MDE)
The MDE is the smallest uplift or decline that the test is designed to reliably detect. There is an inverse relationship between the MDE and the required sample size: detecting a subtle 1% lift requires a significantly larger audience than detecting a 20% "home run" change. Experts suggest that MDE selection should be a business decision based on ROI—calculating whether the cost of implementing a change is justified by the magnitude of the lift being tested.
3. Significance Level (Alpha)
The significance level represents the risk of a false positive. While a 95% confidence level (alpha = 0.05) is the standard, increasing this stringency to 99% (alpha = 0.01) inadvertently reduces power. By raising the bar for what qualifies as a "winner," the test becomes more likely to reject borderline results that are, in fact, true improvements.
4. Data Variability and Variance
Variance is the measure of natural "noise" within the data set. In conversion rate optimization, variance is tied to the baseline conversion rate. In revenue-based testing, variance is often much higher due to the wide spread between a visitor who spends nothing and a "whale" who makes a high-value purchase. Higher variance necessitates a larger sample size to achieve the same level of power.
The Financial and Structural Costs of Underpowered Testing
The implications of running underpowered tests extend beyond academic inaccuracy; they manifest as direct financial losses and the erosion of institutional trust in data.
Consider a Software-as-a-Service (SaaS) entity generating $12 million in Annual Recurring Revenue (ARR). If a checkout optimization creates a 2% lift that goes undetected due to low power, the company loses $240,000 in unrealized growth in the first year alone. Because SaaS models rely on compounding returns, that missing 2% is stripped from the baseline of every subsequent year’s growth trajectory.
Furthermore, underpowered testing leads to what statisticians call the "Winner’s Curse" or effect-size exaggeration. When a test has low power, only the most extreme "noise" in the positive direction can push a result past the significance threshold. Consequently, the "wins" that are reported from underpowered tests are often statistically significant by luck, and their reported lift is frequently double or triple the actual reality. This leads to disappointment when the feature is rolled out and the expected revenue fails to materialize.
Chronology of a Professional Power Analysis
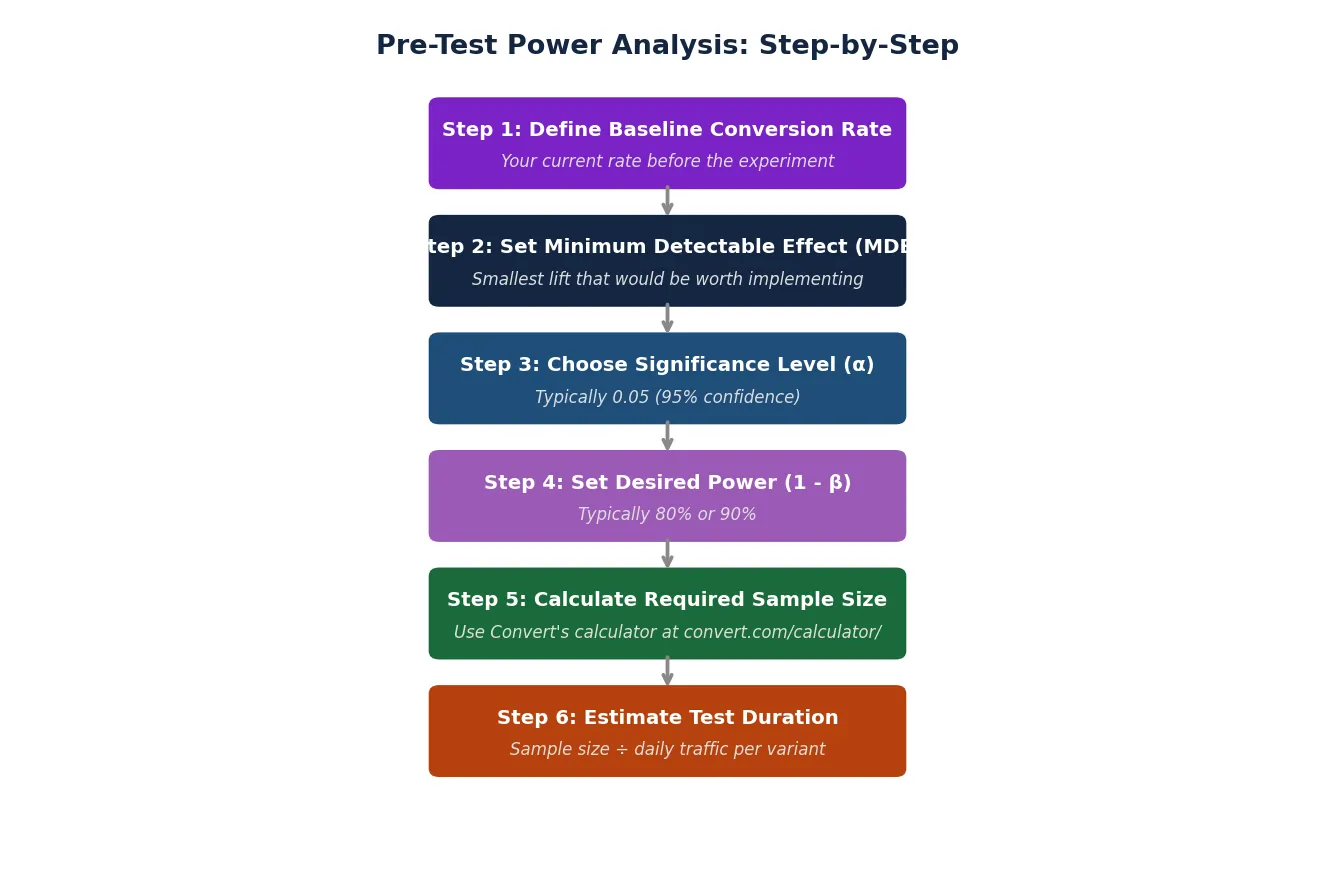
To mitigate these risks, leading data science teams follow a standardized pre-test chronology. This process ensures that every experiment is "viable" before a single line of code is deployed.
- Baseline Establishment: Teams analyze historical data from the previous 30 to 90 days to determine the current conversion rate. This provides the starting point for all sensitivity calculations.
- MDE Calibration: Rather than picking a "hopeful" number, teams set an MDE based on implementation costs and traffic constraints.
- Risk Threshold Selection: The alpha (significance) and beta (power) targets are locked in. While 95% confidence and 80% power are standard, high-stakes tests (such as major pricing changes) may require 99% confidence and 90% power.
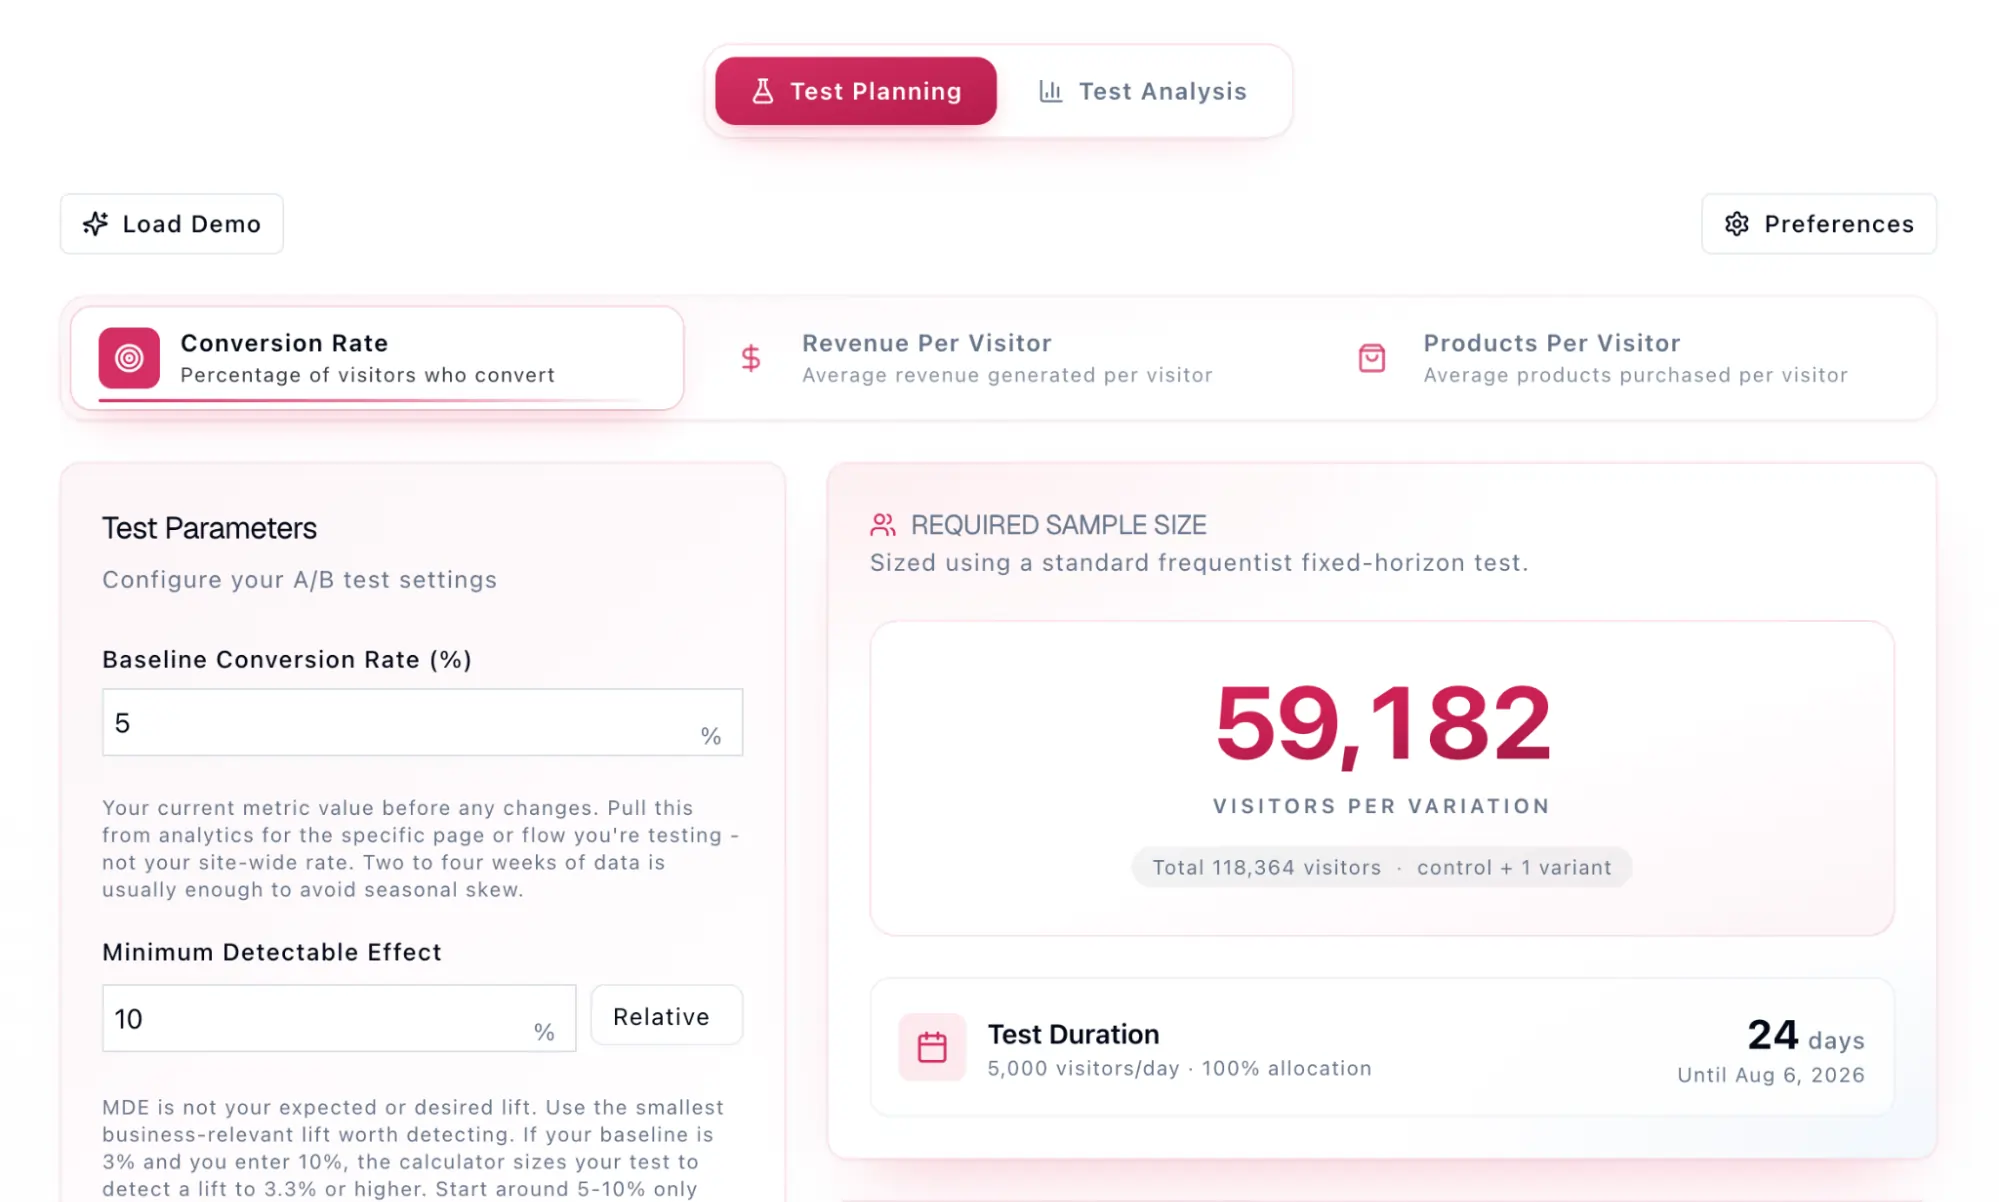
- Sample Size Calculation: Using statistical formulas or specialized calculators, the team determines the exact number of visitors required per variation.
- Duration Estimation: The required sample is divided by average daily traffic to set a fixed end date. This prevents the "peeking" phenomenon, where teams stop tests early because the data looks favorable, a practice that drastically inflates false positive rates.
Methodological Divergence: Frequentist, Sequential, and Bayesian Approaches
The management of power varies significantly across different statistical schools of thought.
- Frequentist Testing: This traditional approach requires a fixed sample size determined in advance. It is the most rigid but provides the clearest protection against both Type I and Type II errors, provided the rules are followed.
- Sequential Testing: Modern tools often utilize sequential monitoring, which allows for "early stopping" if a result is overwhelmingly positive or negative. This method adjusts the significance boundaries dynamically, effectively "spending" power and significance over time to gain efficiency.
- Bayesian Testing: Bayesian models shift the focus from "significance" to "probability of being best." While Bayesian methods do not use a formal power threshold in the same way, they still require sensitivity analysis to ensure the "chance to beat control" is based on sufficient evidence rather than early-stage volatility.
Revenue Per Visitor (RPV): The Variance Challenge
A critical area where power analysis often fails is in the transition from binary metrics (conversions) to continuous metrics (revenue). Because Revenue Per Visitor (RPV) accounts for both conversion rate and Average Order Value (AOV), its variance is inherently higher.
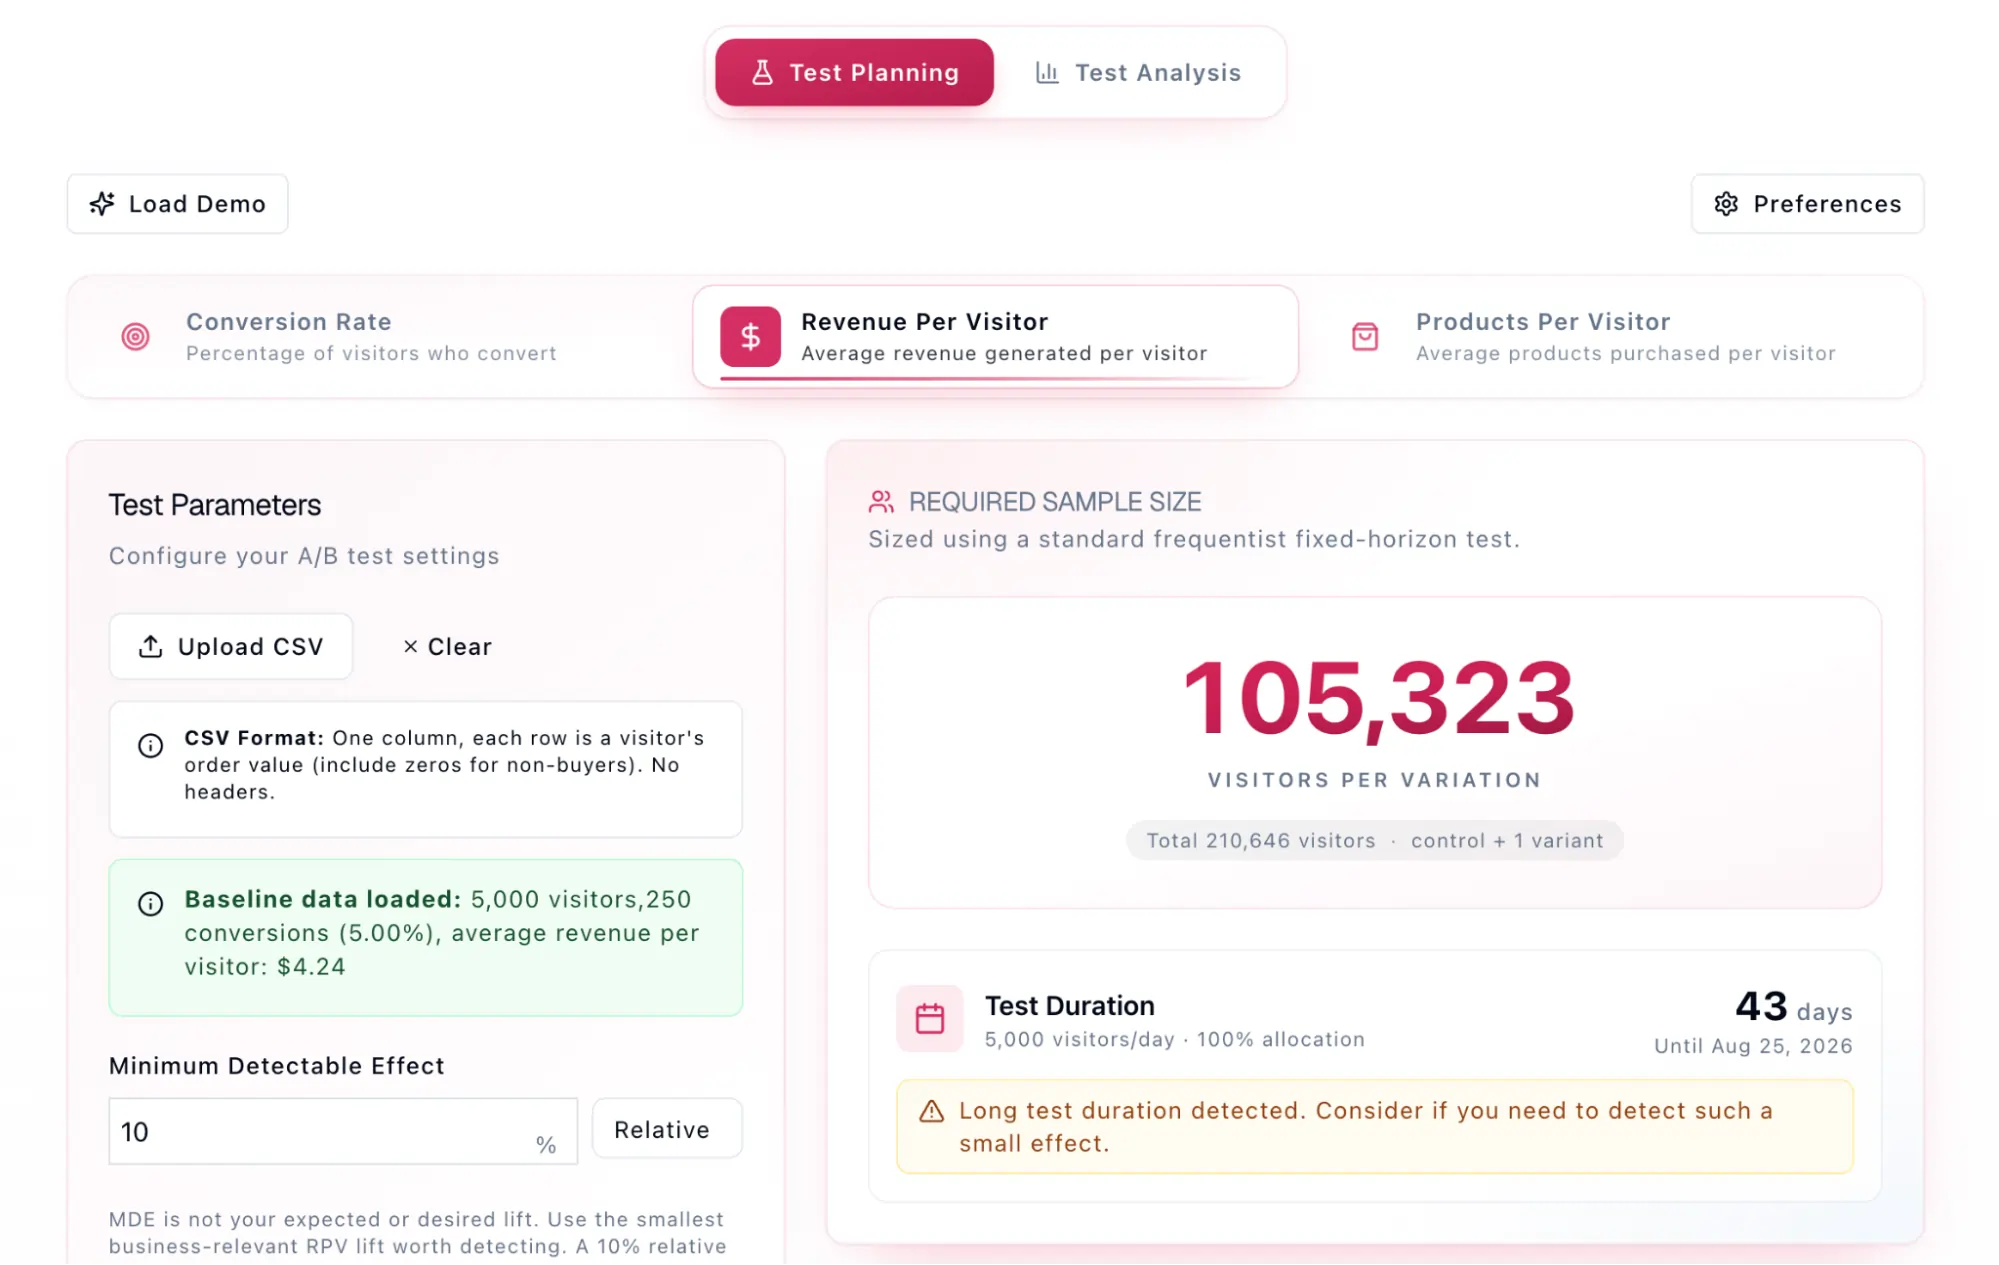
In a recent comparative analysis, it was found that a test designed to detect a 10% lift in conversion rate might require 60,000 visitors per variation. However, to detect that same 10% lift in RPV for the same audience, the required sample could soar to 105,000 visitors. This is due to the "noise" created by varying order sizes. Analysts must account for the standard deviation of historical revenue data to avoid running RPV tests that are destined to return inconclusive results.
Strategic Alternatives for Low-Traffic Environments
For many organizations, achieving 80% power for a small MDE is a logistical impossibility due to traffic constraints. In these instances, a "journalistic" approach to compromise is required.
One strategy is to "Take Big Bets." Rather than testing cosmetic UI changes that might yield a 1% lift, low-traffic sites should focus on radical shifts in value proposition or page architecture aimed at 20% or 30% improvements. Larger effects are easier to detect with smaller samples.
Another option is the acceptance of lower power (e.g., 50% or 60%). While this increases the risk of missing a winner, it allows the testing program to maintain velocity. However, this must be documented as a "provisional" win, requiring further validation. Teams may also choose to run tests exclusively on high-traffic segments, such as mobile-only or specific landing pages, acknowledging that the results may not generalize to the entire site population.
Conclusion: The Future of Evidence-Based Optimization
As digital markets mature, the margin for error in experimentation is shrinking. Statistical power has evolved from a niche concern for data scientists to a core business metric for growth leaders. By prioritizing sensitivity analysis before launching experiments, organizations can ensure that their optimization efforts are not merely "data-driven" in name, but statistically sound and financially productive in practice. The goal of a modern testing program is not just to find winners, but to build a reliable engine of discovery where every "inconclusive" result is a true reflection of reality, and every "win" is a trustworthy foundation for the next stage of growth.