In the competitive landscape of digital optimization, a Conversion Rate Optimization (CRO) team recently executed an A/B/n test involving one control and four distinct variations. To ensure a comprehensive analysis, they tracked three separate success metrics across each layout. When one specific metric on Variant C returned a p-value of 0.04, the team followed standard protocols, declared a winner, and proceeded to ship the change. However, the anticipated revenue surge never materialized. This scenario illustrates a pervasive and often invisible statistical trap known as the multiple comparison problem, a phenomenon that continues to undermine data-driven decision-making across the global tech sector.
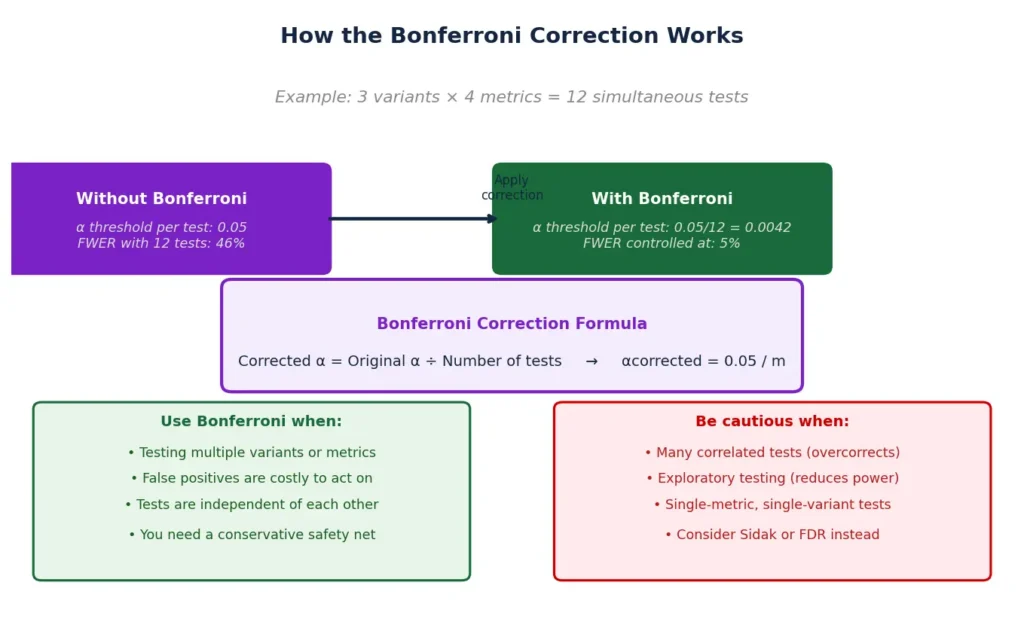
By tracking three metrics across four variants, the team was inadvertently conducting 12 separate statistical comparisons. Under standard independent testing conditions using a 5% significance threshold, the probability of encountering at least one false positive—even if none of the changes had any real effect—climbs to approximately 46%. To combat this, statisticians and data scientists increasingly rely on the Bonferroni correction, a rigorous method designed to adjust significance bars across a family of comparisons. While the correction effectively limits the "Family-Wise Error Rate" (FWER), it introduces a complex trade-off between statistical certainty and the power to detect genuine improvements.
The Mechanics of the Multiple Comparisons Problem
The foundation of most A/B testing rests on the significance threshold, or alpha (α), which is conventionally set at 0.05. This figure represents a calculated risk: the experimenter accepts a 5% chance that a variant will appear successful due to random noise rather than actual performance. This error is categorized as a Type I error, or a false positive.

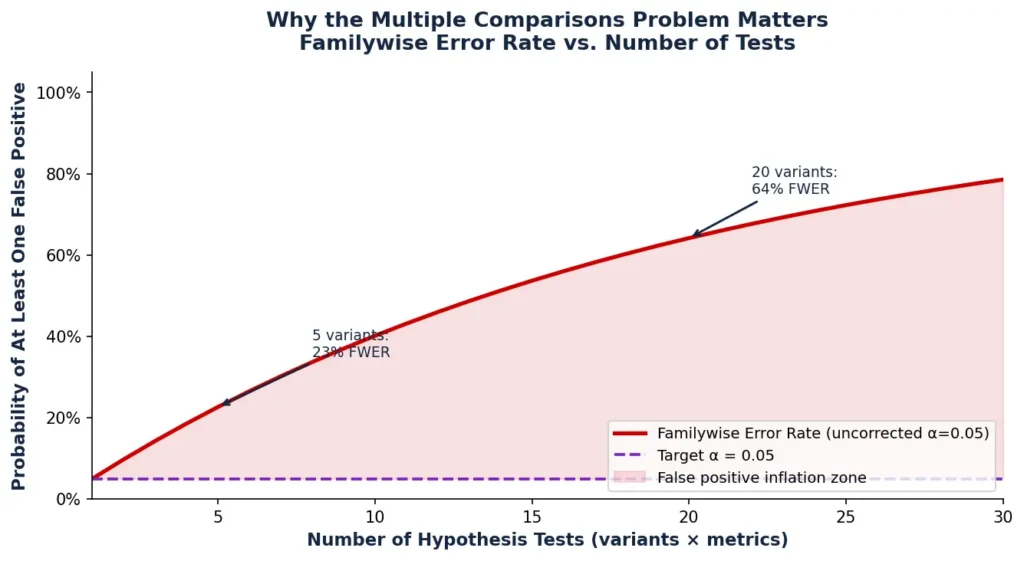
The danger intensifies when this 5% threshold is applied repeatedly within the same experiment. As additional variants or metrics are introduced, the cumulative risk of error compounds. This cumulative risk is measured as the Family-Wise Error Rate (FWER). For independent tests, the formula is expressed as FWER = 1 – (1 – α)^m, where ‘m’ represents the number of comparisons.
Data indicates a rapid escalation of risk as the number of tests grows:
- With 1 comparison, the risk is 5%.
- With 5 comparisons, the risk jumps to 22.6%.
- With 10 comparisons, the risk reaches 40.1%.
- With 20 comparisons, the risk sits at 64.2%.
- With 100 comparisons, a false positive becomes nearly certain at 99.4%.
This statistical reality suggests that without adjustment, many "wins" reported in high-velocity testing environments are likely the result of random fluctuations that happened to cross the threshold by chance.
Implementing the Bonferroni Correction: A Mathematical Overview
The Bonferroni correction offers a straightforward, albeit conservative, solution to the inflation of Type I errors. Instead of evaluating every result against the standard 5% threshold, the experimenter divides the original alpha by the total number of comparisons (m). The resulting figure becomes the new, stricter requirement for statistical significance.

The formula is defined as: α_new = α_original / m.
For example, in a test featuring one control, three variants, and two primary metrics, the total number of comparisons is six (3 variants × 2 metrics). Applying the correction (0.05 / 6) results in a new significance threshold of 0.0083. Under these rules, a p-value of 0.04—which would typically be celebrated as a "win"—fails to meet the criteria for significance.
An alternative method involves adjusting the p-values themselves by multiplying the raw p-value by the number of comparisons (capped at 1.0). If the adjusted p-value remains below the original 0.05 threshold, the result is deemed significant. While both methods are mathematically equivalent, industry experts recommend reporting which specific correction was utilized to maintain transparency in data reporting.
Strategic Applications in High-Stakes Testing
The Bonferroni correction is not a universal requirement for every experiment, but it is considered essential in specific high-stakes scenarios.
1. Multi-Variant Testing Against a Single Control
In A/B/n testing, every additional variant represents a new opportunity for a false positive to emerge. Stricter thresholds are particularly vital when a "win" triggers an expensive or resource-intensive rollout, such as a complete backend migration, a significant brand redesign, or a change in pricing architecture.
2. Simultaneous Evaluation of Primary Metrics
When an experiment measures multiple KPIs—such as Conversion Rate (CVR), Revenue Per Visitor (RPV), and Average Order Value (AOV)—each metric serves as a separate hypothesis. If a team is prepared to ship a change based on any one of these metrics reaching significance, they must account for the increased probability of error across the metric family.
3. Confirmatory Research vs. Exploratory Discovery
The correction is best suited for confirmatory mindsets where a specific hypothesis is being validated. In these instances, the sample size, metrics, and variants are locked in advance. This contrasts with exploratory testing, where the goal is to find "signals" in the noise. While exploratory tests can bypass corrections to avoid missing subtle trends, their findings should be treated as preliminary until validated in a separate, properly powered confirmatory test.
4. High-Cost Failure Environments
In sectors where even a single incorrect conclusion carries heavy penalties—such as financial services, healthcare interfaces, or checkout flows for high-ticket items—the conservative nature of Bonferroni serves as a necessary safeguard against volatile decision-making.
The Downside: Statistical Power and Sample Size Inflation
While the Bonferroni correction protects against false positives, it does so at a significant cost to "statistical power"—the ability of a test to detect a real effect when one actually exists. By lowering the significance threshold, the test requires much stronger evidence to declare a winner. This increases the risk of Type II errors, or false negatives, where a genuine product improvement is rejected because it failed to meet an artificially high bar.
Furthermore, the correction necessitates a substantial increase in sample size. To maintain the same level of power (usually 80%) under a stricter alpha, the volume of required traffic can swell significantly. For a test with five variants, the alpha drops to 0.01. Depending on the Baseline Conversion Rate and the Minimum Detectable Effect (MDE), this could require 50% to 100% more traffic than a standard A/B test. In low-traffic environments, this can extend the duration of an experiment from weeks to months, leading to "decision paralysis" and high opportunity costs.
Comparative Analysis of Alternative Correction Methods
Recognizing the rigidity of the standard Bonferroni method, statisticians have developed several alternatives that offer varying degrees of flexibility.
Holm-Bonferroni (The Step-Down Method)
The Holm-Bonferroni method is more adaptive. It ranks p-values from smallest to largest and applies the strictest threshold only to the most significant result. If that result passes, the threshold for the next p-value is slightly relaxed. This process continues until a result fails, at which point all subsequent results are declared non-significant. This preserves more statistical power than the plain Bonferroni method while still controlling the FWER.

Benjamini-Hochberg (False Discovery Rate)
Unlike Bonferroni, which seeks to prevent any false positives, the Benjamini-Hochberg (BH) method controls the proportion of false positives among the results declared significant. This is known as the False Discovery Rate (FDR). This method is widely used in exploratory research and genomics, where identifying as many true effects as possible is more important than avoiding a single false lead.
Dunnett’s Test
In many A/B/n tests, the experimenter only cares about how each variant performs against the control, not how the variants compare to each other. Dunnett’s test accounts for the fact that all variants share the same control group data. Because it models this correlation, it is less punishing than Bonferroni, making it the preferred choice for most standard multi-variant web experiments.
Šidák Correction
Similar to Bonferroni, the Šidák correction assumes the tests are independent. It offers a slightly higher (more lenient) threshold than Bonferroni, though the difference is often negligible unless the number of comparisons is very large.
Chronology of Implementation and Common Pitfalls
Even seasoned data analysts encounter hurdles when implementing these corrections. The lifecycle of a corrected test typically follows this timeline:

- Pre-Test Planning: Defining the family of hypotheses and calculating the required sample size based on the corrected alpha.
- Execution: Gathering data without "peeking," as repeated looks at the data further inflate the multiple comparison problem.
- Analysis: Applying the correction automatically through testing platforms or manual calculation.
- Verification: Comparing the results against secondary "guardrail" metrics to ensure the "win" didn’t cause unintended damage elsewhere.
Common mistakes include "post-hoc segmentation," where a tester slices data by device, browser, or geography after the test ends to find a winning segment. This introduces dozens of new comparisons that are rarely accounted for, leading to a high rate of false discoveries. Additionally, some teams mistakenly include "guardrail" metrics (metrics used only to monitor for negative impacts) in their Bonferroni calculations, which unnecessarily penalizes the primary KPI.
Broader Implications for the Industry
The move toward more rigorous statistical corrections reflects a maturing of the digital experimentation industry. As companies shift from "testing everything" to building sophisticated experimentation programs, the focus is moving away from the quantity of "wins" and toward the quality and replicability of data.
The long-term impact of ignoring the multiple comparison problem is the accumulation of "technical debt" in the form of features that don’t actually work. When a company ships a false positive, they commit resources to maintaining a feature that provides no value, potentially cluttering the user interface and complicating the codebase. By adopting corrections like Bonferroni, Holm, or Dunnett’s, organizations ensure that their product roadmaps are built on a foundation of genuine user insight rather than statistical mirages.
As testing platforms continue to integrate these corrections into their native reporting, the barrier to entry for rigorous statistics is lowering. The challenge for modern CRO teams is no longer just running tests, but balancing the mathematical necessity of error control with the operational need for speed and innovation.