In the competitive landscape of digital marketing and product development, A/B testing has emerged as a cornerstone of evidence-based growth. However, the mere implementation of an experiment does not guarantee success; the integrity of the results depends entirely on the rigor of the analysis. While modern A/B testing tools are proficient at identifying which variation performed better in a controlled environment, they often lack the contextual depth to determine if those results are statistically sound enough to inform long-term business strategies. Accurate analysis is the bridge between raw data and actionable intelligence, ensuring that organizations do not fall victim to "false wins" that evaporate once a new feature is deployed to the entire user base.
The Fundamental Mechanics of A/B Test Analysis
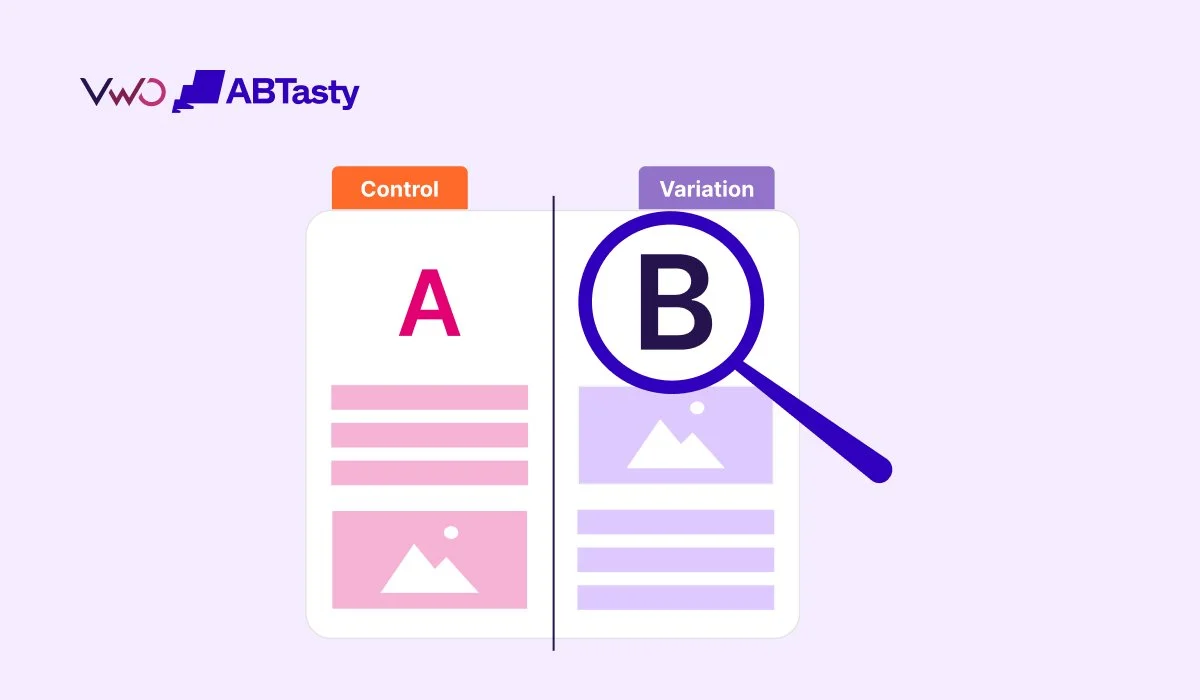
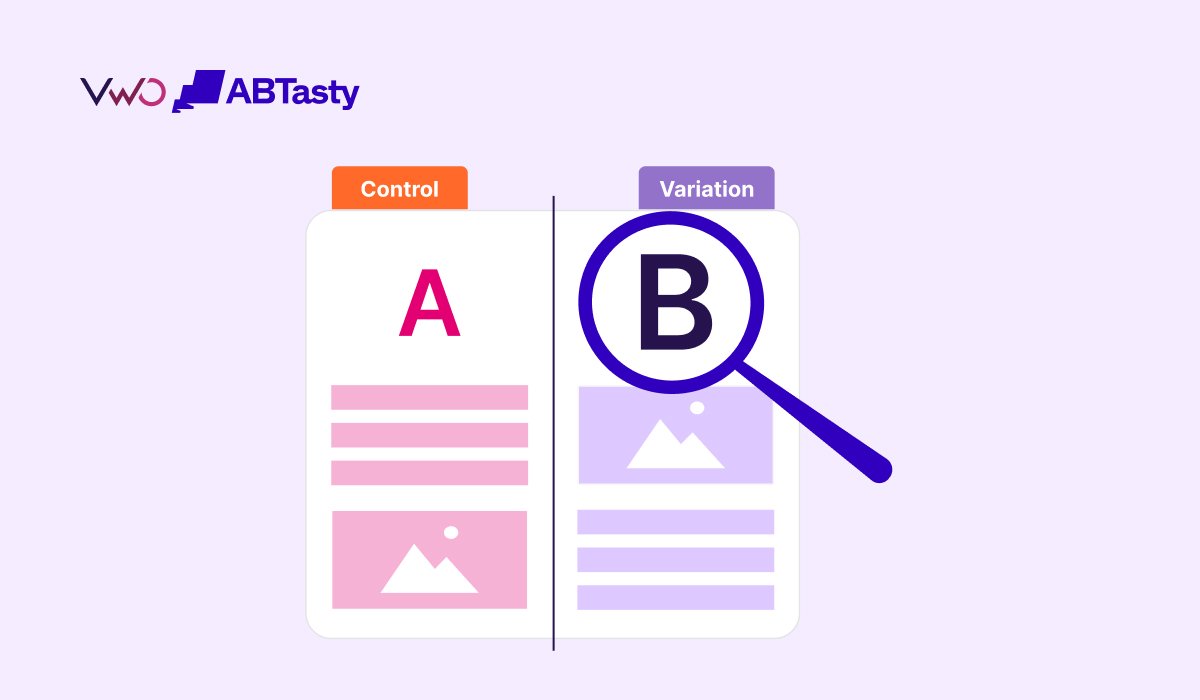
A/B testing, at its core, is a method of comparing two versions of a digital asset—be it a webpage, an email, or a specific user flow—to determine which one achieves a specific goal more effectively. Users are split into two groups: the Control group, which interacts with the original version, and the Variant group, which sees the modified version. The resulting dataset typically includes primary metrics such as conversion rates, secondary engagement metrics, and statistical confidence indicators.
The challenge for many growth teams is not the collection of data, but its interpretation. A result may appear convincing on the surface, showing a double-digit lift in conversions, yet remain statistically insignificant due to inadequate sample sizes or premature termination of the test. Industry experts note that teams often succumb to the "peeking problem," where they monitor results daily and stop the experiment the moment a positive trend emerges. This practice significantly inflates the probability of Type I errors (false positives), leading to "implementation regret" when the projected gains fail to materialize in a real-world setting.
A Seven-Step Framework for Rigorous Analysis
To mitigate these risks, analysts recommend a standardized seven-step protocol for evaluating experiment results, moving from pre-test planning to post-test documentation.
Step 1: Metric Locking and Pre-Registration
The most critical phase of analysis occurs before the test even begins. Analysts must define primary, secondary, and guardrail metrics at the launch stage. The primary metric is the "North Star" of the experiment, such as a purchase or a sign-up. Guardrail metrics, such as bounce rate or page load speed, ensure that improvements in one area do not cause unintended harm elsewhere. Changing the primary metric after reviewing the data—a practice known as "p-hacking"—invalidates the statistical foundations of the test.
Step 2: Verification of Sample Size and Duration
Before concluding a test, it is essential to confirm that the visitor count per variant is sufficient to detect the Minimum Detectable Effect (MDE). Utilizing tools like Evan Miller’s sample size calculator allows teams to determine the required traffic volume beforehand. Furthermore, tests should ideally run for at least one full business cycle (typically 7 to 14 days) to account for cyclical fluctuations in user behavior, such as differences between weekday and weekend traffic.
Step 3: Data Extraction and Structuring
Once the test duration is complete, data must be pulled from tracking tools like Google Analytics 4 (GA4). Analysts should structure this data cleanly, documenting unique visitors, total conversions, and the resulting conversion rates for each variant. This raw data serves as the input for significance testing and helps identify tracking discrepancies early in the process.
Step 4: Quality Assurance and Sample Ratio Mismatch (SRM)
Data integrity is often compromised by technical glitches that result in uneven traffic distribution. If a test is designed to split traffic 50/50 but results in a 60/40 split, it indicates a Sample Ratio Mismatch (SRM). Results from an experiment with SRM are inherently unreliable, as the imbalance suggests a bias in how users were assigned to variations.
Step 5: Evaluating Statistical Confidence
The confidence level represents the probability that the observed difference between variants is not due to random chance. While a 95% confidence level is the standard for high-stakes decisions, 90% may be acceptable for low-risk changes. Analysts are increasingly moving toward Bayesian models, which offer a "probability of being better" rather than the more abstract p-values found in traditional frequentist models.
Step 6: Granular Data Segmentation
Aggregate results can often mask underlying trends. By segmenting data by device type (mobile vs. desktop), acquisition channel (organic vs. paid), and user type (new vs. returning), analysts can uncover nuances. For instance, a variant might be a clear winner on desktop but a failure on mobile, suggesting that a responsive design tweak is needed rather than a total overhaul.
Step 7: Documentation and Institutional Knowledge
Every test, whether a win, a loss, or a draw, provides valuable insights. Documenting the hypothesis, the variant descriptions, the confidence levels, and the final decision ensures that the organization builds a library of institutional knowledge. This prevents future teams from repeating the same failed experiments and helps refine future hypotheses.
The Role of Statistical Models: Frequentist vs. Bayesian
A significant evolution in A/B testing analysis is the shift from frequentist to Bayesian statistics. The frequentist approach, which has dominated the field for decades, relies on fixed-sample studies. It requires a predetermined sample size and allows for only one check of the data at the end of the test. This model is often at odds with the fast-paced nature of digital business, where stakeholders want to monitor performance in real-time.
The "peeking problem" is a direct consequence of applying frequentist logic to continuous monitoring. If a team checks a frequentist test ten times during its run, the actual confidence level is much lower than the reported 95%.
In contrast, Bayesian sequential testing—used by platforms like VWO’s SmartStats—updates the probability of a variant’s success continuously as new data arrives. This model is better suited for real-world experimentation, as it provides a more intuitive "probability of success" and allows for more flexible decision-making without the same risk of inflating error rates. Furthermore, many modern systems employ a "Region of Practical Equivalence" (ROPE) to determine if a lift is large enough to justify the engineering cost of implementation.
Essential Metrics for Comprehensive Analysis
Relying solely on a single conversion rate can provide a narrow view of user behavior. Professional analysts track a suite of metrics to gain a 360-degree view of the experiment’s impact:
- Click-Through Rate (CTR): Measures engagement with specific elements like Call-to-Action (CTA) buttons.
- Form Completion Rate: Critical for lead-generation pages where friction in the signup process is a primary concern.
- Funnel Drop-off Rate: Identifies the specific step in a multi-stage process (like a checkout flow) where users abandon their journey.
- Revenue Per Visitor (RPV): Particularly vital for e-commerce, as it accounts for average order value. A variant that increases conversions but lowers total revenue is a net loss for the business.
- Bounce Rate and Time on Page: Serve as proxies for content quality and engagement depth.
Industry Perspectives on Data-Driven Strategy
Jared Brown, a prominent voice in the experimentation space, emphasizes the importance of patience in the analysis process. "A common mistake I’ve observed is not giving tests enough time to run or basing decisions on insufficient data," Brown notes. "This can lead to premature conclusions that aren’t statistically significant, potentially steering strategies in the wrong direction. The goal of A/B testing is not just to increase short-term metrics but to gather insights that can drive long-term strategies and innovation."
This sentiment is echoed across the industry, where the focus is shifting from "winning" tests to "learning" from every experiment. High-maturity organizations view A/B testing as a risk-mitigation tool that prevents the rollout of detrimental features while identifying high-impact opportunities for growth.
Navigating the Tool Ecosystem
For teams operating on limited budgets, a combination of free tools can provide a robust analysis workflow. Google Analytics 4 serves as the primary engine for data collection and segmentation, while Evan Miller’s tools offer the necessary statistical planning and verification. Spreadsheets remain a reliable method for documenting results and visualizing trends through line and bar charts.
However, as experimentation programs scale, the manual overhead of "stitching together" these tools can lead to inefficiencies and errors. Integrated platforms like VWO or AB Tasty provide an end-to-end solution, combining heatmaps, session recordings, and Bayesian-powered analytics in a single interface. These platforms often include automated SRM detection and outlier alerts, which are difficult to manage manually.
Broader Implications for Digital Innovation
The implications of accurate A/B test analysis extend far beyond marketing. In product management, it informs the roadmap by validating which features truly resonate with users. In UX design, it settles debates between subjective opinions by providing objective behavioral data. As the digital economy becomes increasingly saturated, the ability to accurately interpret user data will be the primary differentiator between companies that thrive and those that stagnate.
Ultimately, A/B testing is a scientific discipline applied to the art of business. By adhering to rigorous analysis standards, utilizing the right mix of tools, and fostering a culture of curiosity and documentation, organizations can transform their decision-making processes from guesswork into a precise, data-driven engine for innovation. The path forward involves not just running more tests, but running better ones—where every conclusion is backed by a solid statistical foundation and every insight contributes to a deeper understanding of the customer.