The global mobile application market, currently valued at hundreds of billions of dollars, has reached a point of saturation where user retention is the primary differentiator between market leaders and forgotten software. While the majority of mobile app professionals utilize sophisticated analytics suites to monitor performance, a critical gap remains in the standard analytical workflow. For years, the industry has relied heavily on quantitative data—the "what" of user behavior—while frequently overlooking the qualitative "why." This imbalance has led to a plateau in optimization efforts, prompting a strategic shift toward more holistic analytical frameworks that combine numerical data with visual behavioral insights.
The Quantitative Ceiling and the Need for Context
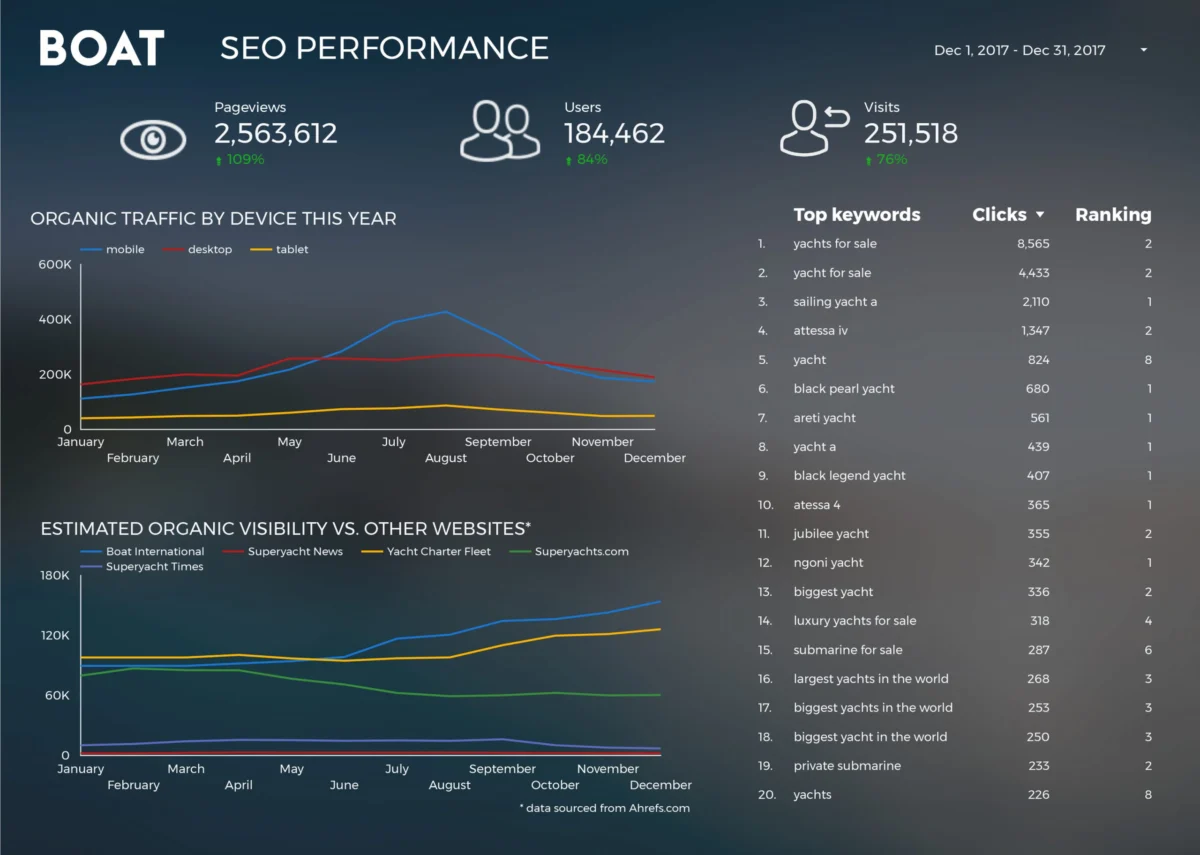
In the current digital landscape, quantitative analytics serves as the bedrock of app management. Platforms like Google Analytics for Firebase, Mixpanel, and Amplitude provide developers with a wealth of numerical data, including daily active users (DAU), churn rates, session lengths, and conversion funnels. These metrics are indispensable for identifying symptoms of poor performance. For instance, a quantitative report might reveal that 40% of users drop off at the registration screen or that the average session duration has plummeted following a recent update.
However, quantitative data is inherently limited by its inability to provide context. It can signal that a problem exists, but it cannot explain the human frustration or technical nuance behind the numbers. If a user abandons a shopping cart, the quantitative data shows the exit point but remains silent on whether the user encountered a confusing UI element, a broken button, or a slow-loading payment gateway. This "contextual void" often forces development teams into a cycle of guesswork, where they implement various "fixes" based on hypotheses rather than evidence. To break this cycle, industry leaders are increasingly adopting qualitative analytics to complete the narrative of the user journey.
The Mechanisms of Qualitative Observation: Heatmaps and Recordings
Qualitative analytics introduces a visual layer to data interpretation, primarily through two technological pillars: touch heatmaps and user session recordings. These tools transform abstract data points into observable human interactions.
Touch Heatmaps and the Science of Interaction
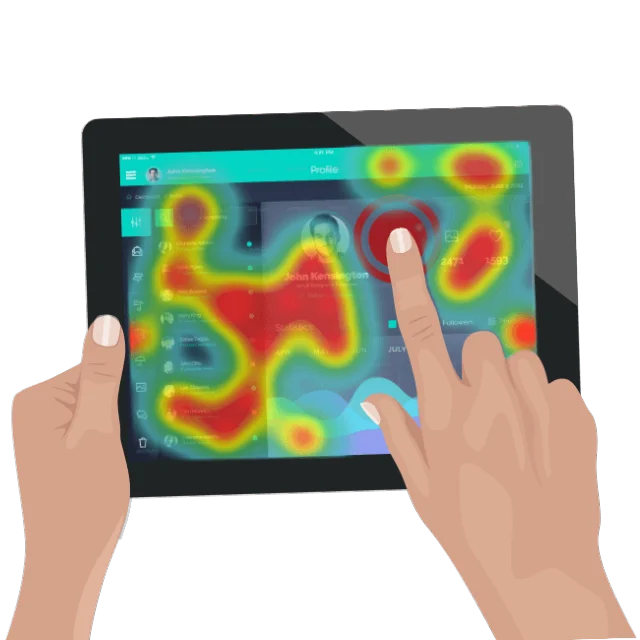
Touch heatmaps aggregate every gesture performed by users—taps, double-taps, swipes, and pinches—across every screen of the application. By overlaying this data onto the app’s interface, developers gain a visual representation of user focus. Areas with high interaction density appear as "hot spots," while ignored elements remain "cold."
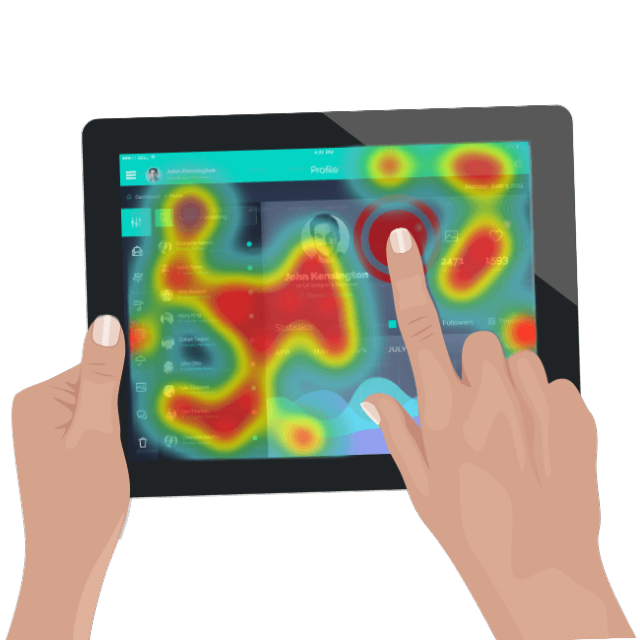
Beyond identifying popular features, heatmaps are vital for detecting "unresponsive gestures." These occur when a user taps an element—such as an image they believe is a link or a button that fails to trigger an action—and receives no feedback from the app. From a journalistic and technical perspective, unresponsive gestures are the "canaries in the coal mine" for user experience. They indicate a fundamental misalignment between user expectations and UI design. Industry studies suggest that repeated unresponsive gestures are one of the leading causes of "rage-quitting," where a user exits and uninstalls an app out of sheer frustration. By analyzing these heatmaps, designers can identify where the interface is counter-intuitive and adjust the layout to match natural user behavior.
User Session Recordings: The Unbiased Witness
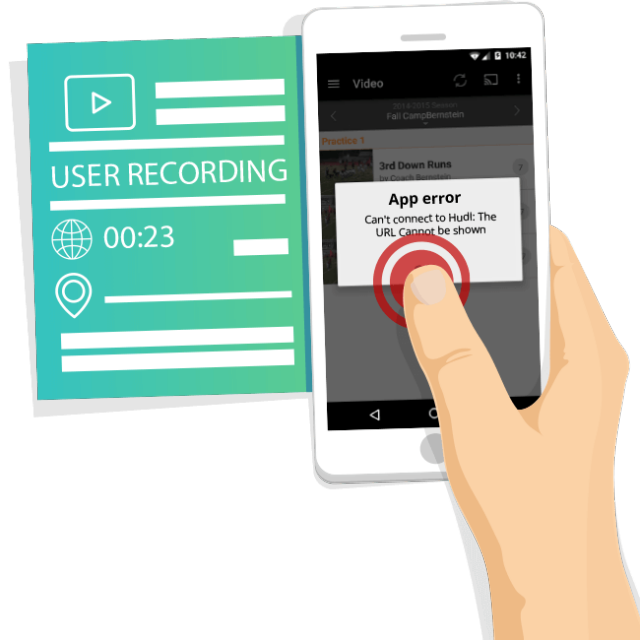
If heatmaps provide a bird’s-eye view of interaction, user session recordings offer a first-person perspective. This technology captures the entirety of a user’s session, allowing professionals to watch exactly how a person navigates the app in real-time. Unlike traditional usability testing, which often takes place in a controlled laboratory environment and can be influenced by the "Hawthorne Effect" (where individuals modify their behavior because they are being observed), session recordings capture "in the wild" behavior.
This raw, unaltered data is essential for troubleshooting complex issues. For example, if an app crashes, a session recording can reveal the exact sequence of events leading up to the failure. It might show a user attempting to upload a high-resolution file while simultaneously toggling a settings menu—a specific edge case that might not be caught by automated bug-reporting software. Furthermore, session recordings are invaluable for understanding demographic-specific behaviors, helping teams tailor their products for different regions, age groups, or device types without sacrificing performance.
A Chronology of the Modern Optimization Workflow
The integration of qualitative data has fundamentally altered the timeline of app development and maintenance. The traditional reactive model is being replaced by a proactive, data-fueled optimization cycle.
- The Alarm Phase (Quantitative): The process begins with quantitative monitoring. An automated alert might indicate a sudden spike in the "bounce rate" on a specific landing page or a drop in "in-app purchases."
- The Investigation Phase (Qualitative): Instead of immediately rewriting code, the team consults qualitative tools. They review heatmaps to see if a new promotional banner is obscuring a "checkout" button or watch session recordings to see if the payment screen is failing to load on specific operating systems.
- The Resolution Phase (Development): Armed with visual evidence, the development team can implement a precise fix. This reduces the "Mean Time to Repair" (MTTR) and prevents the introduction of new bugs that often result from "blind" coding.
- The Verification Phase (Feedback Loop): After the fix is deployed, the team monitors both the numbers (to see if the bounce rate recovers) and the recordings (to ensure users are now navigating the path as intended).
Industry Benchmarks and the Financial Impact of UX Friction
The shift toward qualitative analytics is driven by harsh economic realities in the mobile sector. According to industry data from 2023, the average cost per install (CPI) for mobile apps has continued to rise, making user acquisition more expensive than ever. Conversely, statistics show that nearly 25% of users abandon an app after only one use.
The financial implication is clear: losing a user due to a preventable UX flaw is a direct hit to the bottom line. Research from Forrester and other analytical firms suggests that every dollar invested in ease of use and user experience brings a return between $10 and $100. By utilizing qualitative analytics to remove friction, companies can significantly improve their Customer Lifetime Value (CLV) and reduce the "leaky bucket" syndrome where expensive marketing efforts are wasted on a product that users cannot or will not use.
Proactive Troubleshooting and Brand Integrity
Beyond immediate financial metrics, qualitative analytics plays a critical role in maintaining brand reputation. In the age of social media and app store reviews, a single widespread bug can lead to a deluge of one-star ratings that are difficult to overcome.
Proactive troubleshooting allows teams to identify "micro-frictions" before they escalate into "macro-failures." For instance, a developer might notice through session recordings that users are consistently mistyping their email addresses because the keyboard layout provided by the app is inappropriate for the text field. While this might not cause an immediate crash or a massive drop in numbers, it creates a "low-grade" frustration that erodes brand loyalty over time. Addressing these minor issues proactively ensures a seamless experience that fosters long-term retention.
Strategic Implications and the Future of App Management
The convergence of quantitative and qualitative data represents a maturing of the mobile industry. We are moving away from an era of "Big Data" for its own sake and toward an era of "Actionable Insight."
Industry experts suggest that the next frontier will involve the integration of Artificial Intelligence (AI) with qualitative tools. AI algorithms are already beginning to "watch" thousands of session recordings simultaneously, automatically flagging sessions where users appear "confused" or where "rage clicks" are detected. This will allow app professionals to scale their qualitative analysis, moving from manual review to automated, high-level behavioral oversight.
In conclusion, the modern mobile app environment is too competitive for guesswork. While quantitative analytics provides the necessary framework for measuring success, qualitative analytics provides the substance required to achieve it. By revamping workflows to include touch heatmaps and session recordings, app professionals can transform their products from functional software into intuitive, user-centric experiences. The result is a more robust development cycle, higher user satisfaction, and a significant competitive advantage in an increasingly crowded marketplace. The "fresh twist" of qualitative insight is no longer an optional luxury; it is a fundamental requirement for any mobile powerhouse.