The landscape of digital experimentation is currently facing a silent crisis of productivity as a growing number of organizations report that their A/B testing programs are yielding a high volume of inconclusive results. This phenomenon, often characterized by the repetitive cycle of launching variations only to have testing platforms return "no significant difference" after weeks of data collection, has begun to undermine the perceived value of data-driven decision-making in the corporate sector. Recent industry analysis suggests that the root cause of this stagnation is not necessarily a lack of creative talent or poor experimental design, but rather the misapplication of rigid academic statistical standards to the high-velocity requirements of modern business.
The Mechanism of Inconclusive Results
In a typical experimentation lifecycle, a product or marketing team identifies a potential improvement, designs a variation, and allocates traffic for a period of four to eight weeks. However, under the standard operating procedures of most testing platforms, the bar for "success" is set at a 95 percent confidence interval. When an experiment concludes without reaching this threshold, it is labeled "inconclusive," effectively halting progress and preventing the implementation of changes that may, in fact, provide a genuine benefit to the user experience.

This pattern of inconclusivity often leads to a chilling effect within organizations. Designers become hesitant to propose bold changes, analysts find themselves producing reports devoid of actionable insights, and stakeholders begin to question the return on investment for the experimentation infrastructure. Data suggests that for many mid-sized enterprises, the 95 percent confidence threshold is mathematically misaligned with their actual traffic volumes and baseline conversion rates, leading to an environment where only extreme outliers are ever "certified" as winners.
Chronology of a Statistical Standard
The adoption of the 95 percent confidence interval (p < 0.05) traces its origins back to the work of Sir Ronald Fisher in the 1920s. Fisher’s standards were designed for agricultural and biological research, where the cost of a false positive—such as claiming a new fertilizer works when it does not—could lead to years of wasted academic effort and resource misallocation.
Throughout the late 20th century, this standard was adopted by the pharmaceutical and social science sectors to ensure rigorous peer-review processes. As digital commerce emerged in the early 2000s, the first generation of A/B testing tools simply ported these academic requirements into the business world. For the last two decades, this "gold standard" has remained largely unchallenged, despite the fundamental differences between scientific discovery and iterative business optimization.

Data Analysis: The Simulation of Stochastic Paths
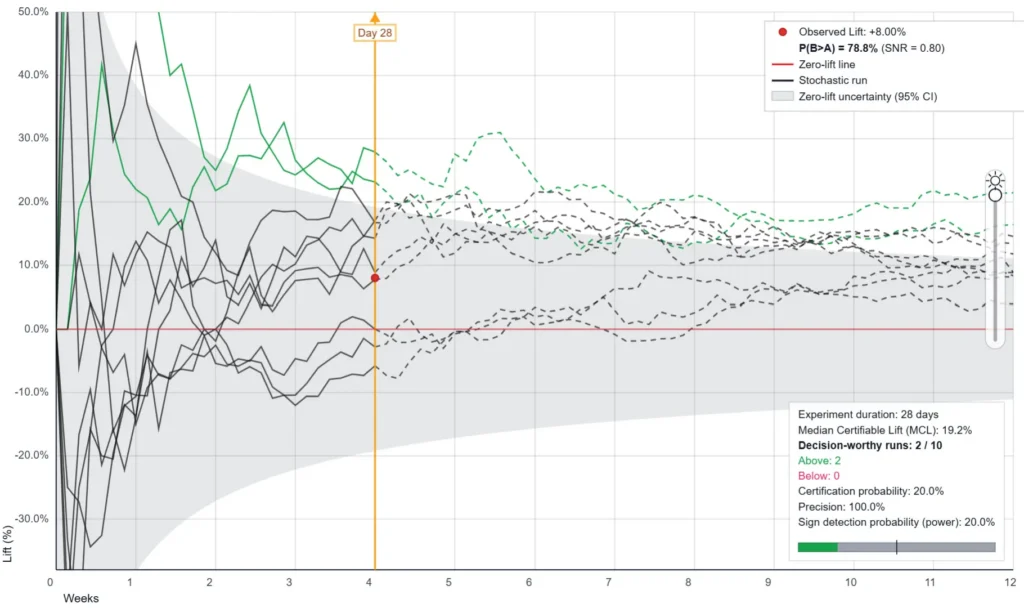
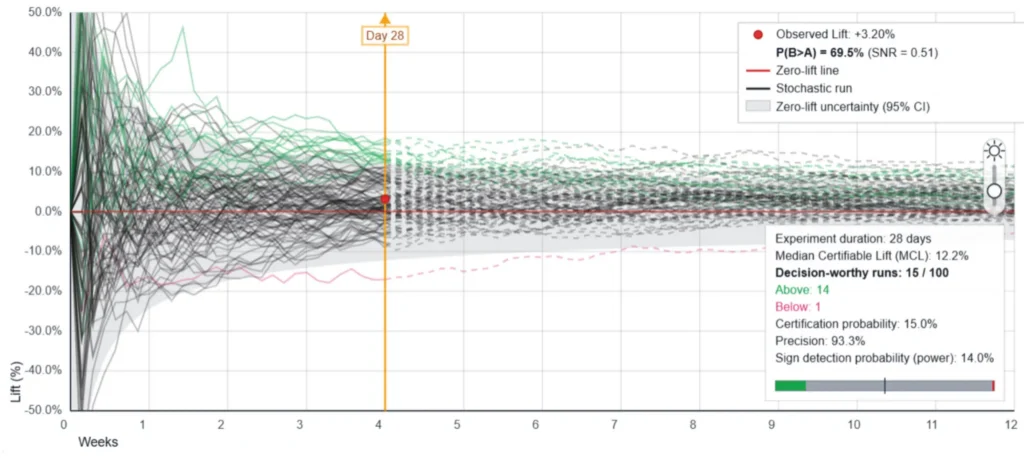
To understand the frequency of inconclusive results, researchers have utilized stochastic path simulators to model the behavior of experiments under realistic business conditions. In a controlled simulation involving 500 conversions over a four-week period with a true underlying lift of +3.2 percent, the limitations of traditional policies become clear.
When running this experiment 100 times under identical conditions—where the only variable is the random noise inherent in human behavior—the results are revealing:
- Certification Rate: Only 15 out of 100 experiments reached the 95 percent confidence threshold.
- Inconclusive Rate: 85 percent of the tests failed to produce a definitive result, despite the existence of a real, positive improvement.
- Median Certifiable Lift (MCL): Under this specific policy, the "true lift" would need to be at least 12.2 percent for the experiment to have even a 50 percent chance of being certified as a winner.
This data illustrates a significant disconnect. Most digital optimizations—such as button color changes, headline tweaks, or layout adjustments—produce incremental gains in the 2 percent to 5 percent range. By holding these experiments to a standard that requires a 12 percent gain for detection, businesses are effectively blind to the majority of their successful innovations.
The Double Standard in Corporate Decision-Making
A critical analysis of corporate governance reveals a stark double standard in how data is treated inside and outside of the testing lab. In most organizations, a Chief Marketing Officer (CMO) may approve a $100,000 advertising campaign based on a "gut feeling" or a 60 percent confidence level derived from qualitative focus groups. Similarly, product teams often ship new features based on positive customer interviews and competitive analysis, where the mathematical probability of success is rarely quantified but is estimated to be between 60 percent and 80 percent.
These are considered sound, professional business decisions. However, when the same organization runs an A/B test, they suddenly demand a 95 percent two-sided confidence interval. Mathematically, a two-sided 95 percent CI is equivalent to a 97.5 percent one-sided confidence that the variation is better than the control. This means that a business is holding a simple website tweak to a standard of proof that is 30 to 40 percentage points higher than the standard used for major capital expenditures or strategic shifts.
Alternative Frameworks: Signal-to-Noise Ratio (SNR)
In response to the "inconclusivity trap," some data scientists are advocating for a shift toward decision policies based on the Signal-to-Noise Ratio (SNR). SNR is defined as the ratio between the observed difference in conversion rates (the signal) and the uncertainty or variance of that difference (the noise).
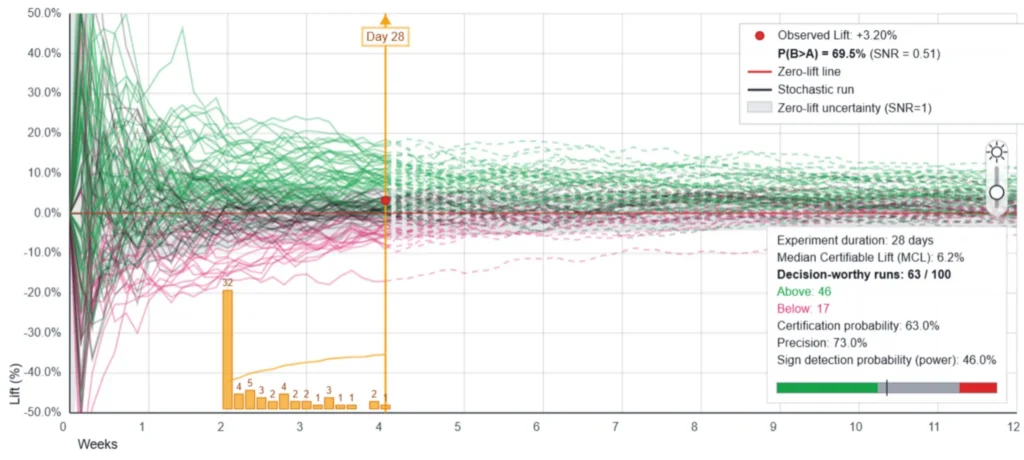
In a comparative simulation using an SNR = 1 threshold with daily monitoring after a two-week minimum, the outcomes shifted dramatically:
- Winner Identification: The program correctly identified the +3.2 percent lift in nearly 50 percent of cases, compared to just 15 percent under the 95 percent CI.
- Velocity: The time to decision was reduced, allowing teams to iterate faster.
- Precision Trade-off: The cost of this increased velocity was a decrease in precision. Under the 95 percent CI, precision was 93.3 percent. Under SNR = 1, it fell to 73.0 percent.
This means that while the team ships more winners, they also accept that approximately 3 out of every 10 "wins" might actually be neutral or slightly negative. For many businesses, the cumulative gain from shipping four real winners and one "false" winner is significantly higher than the gain from shipping only one "perfectly verified" winner over the same time period.
Operationalizing Risk and Reversibility
Experts suggest that the "correct" statistical threshold should be a design choice based on the stakes of the decision. This approach, known as "matching rigor to risk," categorizes experiments based on how easily they can be reversed:
- Low Risk / Highly Reversible: Changes to headlines, button colors, or promotional banners. These can be reverted in minutes. A lower confidence threshold (e.g., 70-80 percent) is appropriate here to favor speed.
- Moderate Risk: Changes to checkout flows or pricing structures. These have a higher impact on revenue and may be harder to undo. These require a moderate threshold (e.g., 85-90 percent).
- High Risk / Irreversible: Fundamental changes to the brand identity, backend database migrations, or permanent price increases. These require the traditional 95 percent or even 99 percent confidence intervals.
Broader Impact and Industry Implications
The move away from a "one-size-fits-all" 95 percent confidence interval represents a maturing of the digital experimentation industry. By shifting the focus from academic "truth" to business "utility," organizations can transform their testing programs from bureaucratic hurdles into genuine growth engines.
Industry analysts predict that the next generation of A/B testing platforms will move away from binary "winner/loser" labels. Instead, they will likely provide risk-assessment dashboards that show the probability of a variation being a winner, the potential downside if it is a loser, and the "cost of waiting" for more data.
The implications for the workforce are also notable. Analysts who are trained to manage "decision policies" rather than just "running tests" become more valuable to the C-suite. They transition from being "statistical gatekeepers" to "risk managers" who help the business navigate uncertainty.

In conclusion, the prevalence of inconclusive results in A/B testing is often a self-inflicted wound caused by the application of inappropriate statistical standards. By acknowledging the stochastic nature of digital traffic and adopting flexible decision policies that align with business risk, companies can unlock the latent potential of their experimentation programs. The goal of business experimentation is not to reach a state of scientific certainty, but to make better decisions faster than the competition. In the modern digital economy, the most significant risk is often not the risk of being wrong, but the risk of doing nothing while waiting for a 95 percent certainty that may never come.