
A common scenario in Conversion Rate Optimization (CRO) involves a dedicated team running an A/B/n test featuring one control and four distinct variations, tracking three primary success metrics across each layout. In this scenario, one specific metric on Variant C produces a p-value of 0.04. Following standard protocol, the team declares a statistically significant winner, implements the change across the entire site, and waits for a projected revenue increase. However, the anticipated growth never materializes. This failure is often the result of an invisible statistical trap known as the multiple comparison problem, a phenomenon where the probability of encountering a false positive increases exponentially with every additional variable tested.
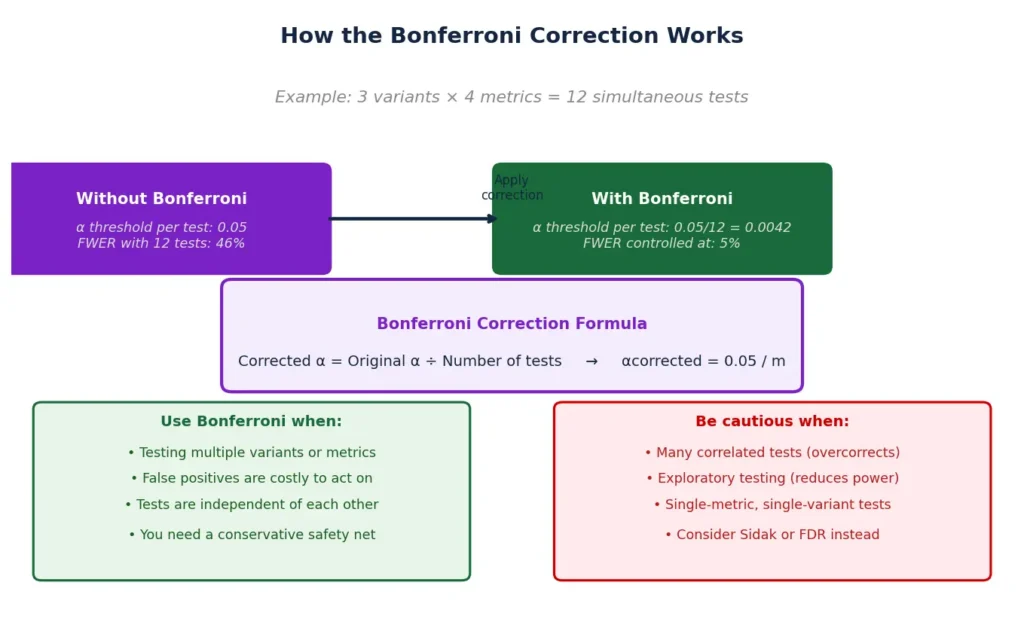
By tracking three metrics across four variants, the team was effectively conducting 12 separate comparisons. Under a standard 5% significance threshold, the mathematical probability of at least one of those comparisons yielding a false positive—even if none of the changes had any real impact—rises to approximately 46%. To combat this, statisticians utilize the Bonferroni correction, a rigorous method designed to adjust significance thresholds and maintain the integrity of experimental data.
The Mechanics of the Multiple Comparison Problem
In the realm of frequentist statistics, the significance threshold, or alpha (α), is the probability of rejecting the null hypothesis when it is actually true. By industry convention, this is typically set at 0.05, or 5%. This threshold represents a calculated risk: the researcher accepts a 5% chance that a result appears successful due to random chance rather than a genuine effect. This error is classified as a Type I error, or a false positive.

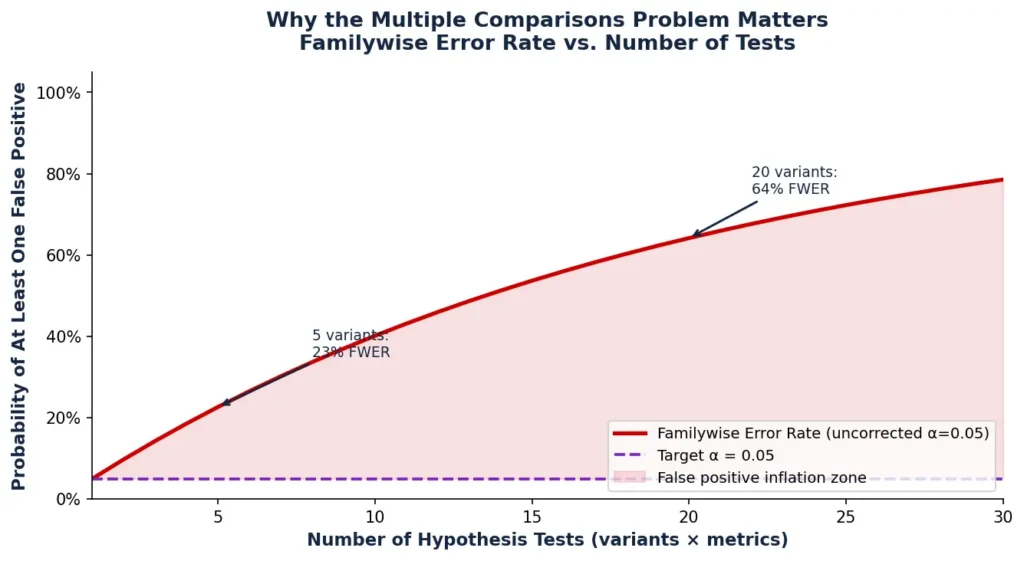
The danger arises when researchers apply this 5% threshold to multiple tests within the same experiment. While the risk for a single test remains at 5%, the cumulative risk across a "family" of tests—known as the Family-Wise Error Rate (FWER)—compounds rapidly. The FWER is calculated using the formula: FWER = 1 – (1 – α)^m, where "m" represents the number of independent comparisons.
Data indicates that the risk of a false positive scales as follows:
- 1 Comparison: 5.0% risk
- 5 Comparisons: 22.6% risk
- 10 Comparisons: 40.1% risk
- 20 Comparisons: 64.2% risk
- 100 Comparisons: 99.4% risk
At 20 independent comparisons, it becomes more likely than not that at least one result will be a false positive. In high-velocity testing environments where companies track dozens of micro-conversions and segment data by geography or device, the likelihood of shipping a "fake win" becomes nearly certain without proper correction.
The Bonferroni Solution: Mathematical Rigor in Testing
The Bonferroni correction, named after the 20th-century Italian mathematician Carlo Emilio Bonferroni, offers a straightforward method to counteract this risk. The procedure requires dividing the original significance threshold by the total number of comparisons performed.

The formula is expressed as: α_new = α_original / m.
For an experiment involving one control, three variants, and two primary metrics, the total number of comparisons is six (3 variants × 2 metrics). To maintain an overall 5% false positive risk, the corrected alpha would be 0.05 / 6, resulting in a new significance threshold of 0.0083. Under this stricter regime, any result with a p-value higher than 0.0083 is dismissed as statistically insignificant, regardless of whether it would have passed the traditional 0.05 mark.
Alternatively, researchers may choose to adjust the p-values themselves by multiplying the raw p-value by the number of comparisons (capped at 1.0). If the adjusted p-value remains below the original 0.05 threshold, the result is considered significant. Both methods are mathematically equivalent and serve to ensure that the cumulative risk of the experiment does not exceed the intended alpha.
Strategic Implementation: When to Apply Strict Corrections
While the Bonferroni correction is a powerful tool for maintaining data integrity, its conservative nature means it is not always the optimal choice for every testing scenario. Statistical experts generally recommend its use in four specific contexts:
1. High-Stakes Confirmatory Testing
When an experiment is designed to validate a specific, pre-defined hypothesis before a major product rollout, the cost of a false positive is high. This includes infrastructure changes, brand-level re-designs, or price adjustments. In these cases, the priority is avoiding an incorrect conclusion that could lead to wasted resources or brand damage.
2. Multi-Variant and Multi-Metric Environments
In A/B/n tests where multiple treatment groups are compared against a single baseline, or where several primary KPIs (such as Conversion Rate, Revenue Per Visitor, and Average Order Value) are used to determine success, the Bonferroni correction provides a necessary safety net against the compounding FWER.
3. Sufficient Traffic and Sample Size
Bonferroni corrections significantly increase the evidence required to reach significance. Consequently, they are best suited for high-traffic websites where the sample size is large enough to detect smaller effects even under a lowered alpha. For low-traffic sites, the correction may render the test duration unfeasibly long.
4. Guardrail Metric Protection
When testing involves "guardrail" metrics—metrics that must not decrease while attempting to improve a primary KPI—applying a correction helps ensure that any observed negative impact is real and not a statistical fluke, allowing for more confident decision-making regarding risk mitigation.
The Trade-off: Statistical Power and Type II Errors
The primary criticism of the Bonferroni correction is its impact on statistical power. Power is the probability that a test will correctly detect a real effect. By lowering the significance threshold, the Bonferroni method inherently makes it harder to "win." This increases the risk of a Type II error, or a false negative, where a genuine improvement is rejected because it failed to meet the ultra-strict corrected threshold.
Consider a scenario where a variant provides a real 3% lift in revenue. At a standard 0.05 alpha, the test might reach significance in three weeks. However, if a Bonferroni correction lowers the alpha to 0.01, the same test might require ten weeks of data to reach the same level of certainty. In fast-paced industries, this delay represents a massive opportunity cost. Furthermore, because the correction treats all metrics as independent—even when they are highly correlated, such as CVR and RPV—it often over-corrects, penalizing the experiment more than is mathematically necessary.
Comparative Analysis of Correction Methodologies
Recognizing the limitations of the standard Bonferroni approach, statisticians have developed several alternatives that offer different balances between error control and statistical power.
Holm-Bonferroni (Step-Down Procedure)
The Holm-Bonferroni method is less conservative than the original. It involves ranking p-values from smallest to largest and applying a graduated threshold. The smallest p-value is tested against α/m, the next against α/(m-1), and so on. This method still controls the FWER but is more likely to detect genuine effects among the secondary results.

Benjamini-Hochberg (False Discovery Rate)
Unlike Bonferroni, which seeks to prevent any false positives, the Benjamini-Hochberg (BH) procedure controls the False Discovery Rate (FDR)—the expected proportion of false positives among all significant results. This is ideal for exploratory research where discovering potential leads is more important than absolute certainty.
Dunnett’s Test
Dunnett’s test is specifically designed for A/B/n testing where multiple variants are compared against a single control. It accounts for the fact that all comparisons share the same control group data, which introduces a correlation. Because it models this shared data, it is more powerful than Bonferroni while still strictly controlling the FWER.
Šidák Correction
The Šidák correction is a slightly more precise version of Bonferroni based on the assumption of independent tests. It uses the formula α_new = 1 – (1 – α)^(1/m). While it provides a marginally higher threshold than Bonferroni, the practical difference in most A/B tests is negligible.
Industry Response and Software Integration
The evolution of testing platforms has made these complex calculations more accessible to non-statisticians. Major experimentation tools, such as Convert, now offer native settings for multiple comparison corrections. Users can typically toggle between Bonferroni, Šidák, or no correction within their frequentist reporting panels.

By integrating these corrections into the automated reporting workflow, companies can reduce the "human error" factor where analysts might be tempted to cherry-pick significant results from a large pool of metrics. Furthermore, modern calculators now allow teams to estimate the "Bonferroni-corrected sample size" before a test begins, enabling better resource planning and more realistic expectations for test duration.
Broader Impact: The Business Case for Statistical Integrity
The long-term impact of ignoring the multiple comparison problem is often felt in the bottom line. When organizations ship "fake wins" based on uncorrected p-values, they accrue technical debt and complicate their codebase with changes that provide no real value. Over time, a series of false positives can lead a product strategy down a path that contradicts actual user behavior.
Moreover, the "replication crisis" observed in scientific literature serves as a cautionary tale for the corporate world. When results cannot be replicated because they were originally the product of p-hacking or multiple comparisons, institutional trust in data-driven decision-making erodes.
Implementing rigorous standards like the Bonferroni correction—or its more flexible counterparts—ensures that when a team claims a "win," that win is backed by robust evidence. While it may result in fewer "successful" tests in the short term, the quality of those successes is significantly higher, leading to more predictable revenue growth and a more accurate understanding of the customer journey. Professional digital experimentation requires a balance: the speed of business must be tempered by the precision of science. Using the Bonferroni correction is a hallmark of an organization that values the latter.