For years, digital marketing and product development teams have operated under a silent paradox: while most major business decisions—from $100,000 ad campaigns to total product overhauls—are made with a "best guess" or moderate evidence, A/B testing results are held to a standard of certainty that frequently paralyzes progress. This divergence, often referred to as the "Double Standard of Experimentation," has led to a crisis of confidence in data-driven programs. Recent industry analysis and statistical simulations reveal that the traditional 95% confidence interval (CI) may be the primary culprit behind the high rate of "inconclusive" results that plague modern growth teams. By adhering to a standard originally designed for academic publishing rather than fast-moving commerce, companies are inadvertently ignoring real winners and stifling innovation.
The Lifecycle of an Inconclusive Experiment
The pattern of failure in many experimentation programs follows a predictable chronology. It begins with a bold hypothesis: a design team proposes a significant change to a checkout flow or a pricing structure. The variation is built, quality-assured, and launched. For the first two weeks, the data fluctuates wildly due to initial noise. By week four, the platform returns a result that is technically positive but fails to cross the 95% confidence threshold. The platform labels the test "inconclusive."

Six months into such a program, the organizational impact becomes visible. Analysts stop finding new insights in reports that consistently say nothing. Designers, weary of having their work rejected by a "flat" test, stop proposing high-impact ideas and pivot toward "safe," incremental changes. Product managers find themselves unable to forecast progress to stakeholders, and executive leadership begins to question the return on investment for the experimentation platform itself. This cycle is not a failure of the team’s creativity or the analysts’ skill, but rather a misalignment between the decision-making policy and the reality of the business’s traffic constraints.
Statistical Simulations Reveal the Cost of Perfection
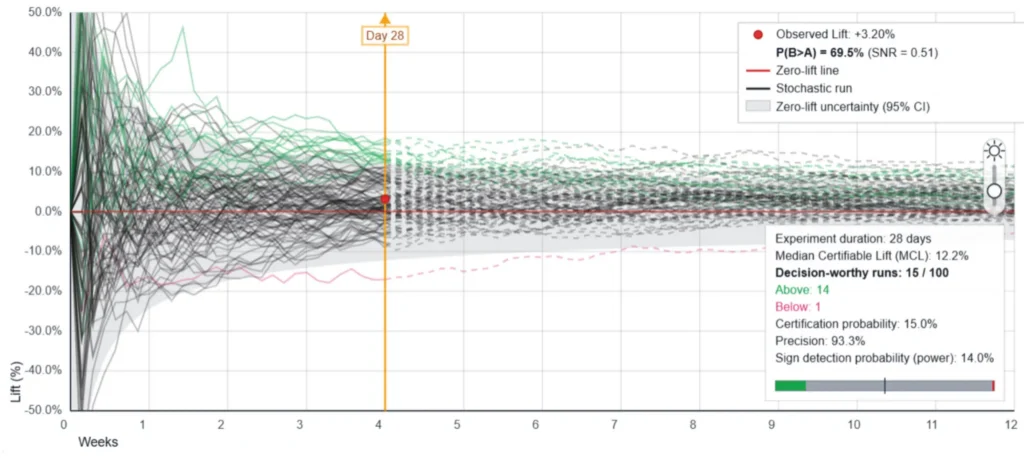
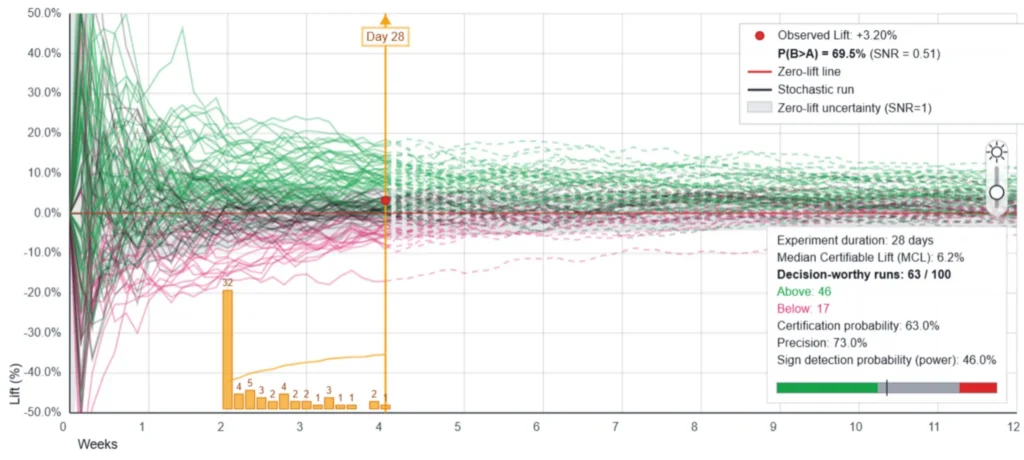
To quantify the impact of high confidence thresholds, data analysts have utilized stochastic path simulators to replay the same experiment 100 times under identical conditions. In a common scenario—a business collecting 500 conversions over four weeks with a true underlying lift of +3.2%—the results are revealing. Under a standard two-sided 95% confidence interval policy, only 15 out of 100 experiments reached a "winning" certification. The remaining 85 experiments returned as inconclusive, despite the fact that a real, positive improvement existed in every single run.
This 85% inconclusive rate is a direct consequence of a decision policy that is mismatched to the problem. When the 95% CI is applied, the "Median Certifiable Lift" (MCL)—the point at which a policy has a 50% chance of calling a winner—is often much higher than the actual effects most businesses produce. In the simulation mentioned, the MCL was 12.2%. Because the true lift was only 3.2%, the policy was mathematically predisposed to fail.

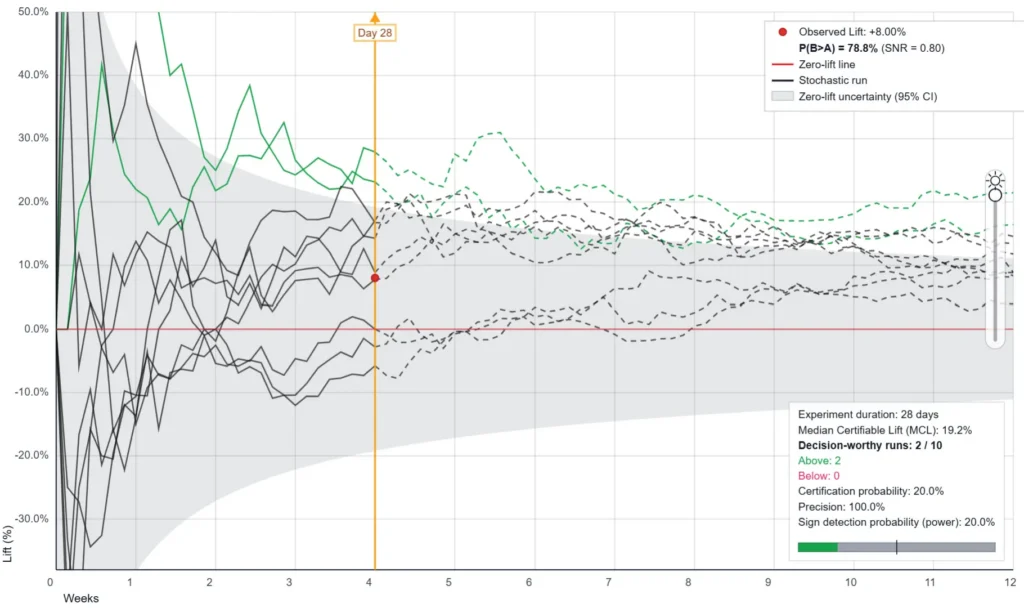
Furthermore, these simulations highlight the "stochastic" nature of conversion rates. Each line on a conversion chart represents just one possible path an experiment could have taken. A test that shows a +8% lift today might have shown a -3% lift if it had run a week earlier or later, purely due to random noise. The confidence interval is designed to describe this uncertainty, yet many practitioners treat the "point estimate" (the +8%) as the absolute truth, ignoring the range of possibility the interval represents.
The Historical Context of the 95% Standard
The 95% confidence threshold is not a law of nature; it is a historical convention. It traces back to the work of Sir Ronald A. Fisher in the 1920s, who established the standard for scientific and academic publishing. In that context, the goal is to prevent false claims from entering the permanent scientific record, which could lead other researchers down unproductive paths for decades.
In a business environment, however, the stakes are different. A false positive on a headline test or a button color change is easily reversible and has a limited downside. Conversely, the "false negative"—rejecting a variation that actually would have improved revenue—carries a massive opportunity cost. By applying the academic "gold standard" to reversible business decisions, organizations are essentially demanding 97.5% one-sided certainty before moving a button, while simultaneously allowing executives to launch multi-million dollar initiatives based on little more than intuition.
Managing Risk through Signal-to-Noise Ratios
A growing movement within the data science community advocates for a shift toward "Signal-to-Noise Ratio" (SNR) as a primary decision metric. SNR measures the ratio between the observed difference in conversion rates (the signal) and the uncertainty of that difference (the noise). When SNR equals one, the observed difference is exactly as large as the uncertainty surrounding it. This represents a natural first decision point where the data begins to provide meaningful directional information.
In comparative simulations, switching from a 95% CI to an SNR=1 policy with daily monitoring dramatically changes the output of an experimentation program. In the same +3.2% lift scenario, the SNR=1 policy correctly identified the winner in 46% of cases, compared to just 15% under the traditional model. While this lower threshold increases the risk of a "wrong-direction" call (precision falls from approximately 93% to 73%), it effectively triples the number of real winners that are successfully shipped to production.
For a company running 50 experiments a year, this shift represents the difference between shipping 7 winners and shipping 23 winners. While the latter group may include a few more "false starts," the aggregate gain from the additional 16 winners often far outweighs the minor losses from misidentified gains.
Implementing a Tiered Decision Policy
Experts suggest that the solution is not to lower standards globally, but to match the rigor of the test to the stakes of the decision. This "tiered" approach to experimentation policy involves four key pillars:
-
Pre-Launch Sign Detection Analysis: Instead of asking how many users are needed, teams should calculate the "sign detection probability" based on their actual traffic and a realistic duration. If the probability is below 20%, the team should acknowledge that the test is likely to be inconclusive before they even begin.
-
Negative Scenario Simulation: Before committing to a lower threshold, teams should simulate "danger zones"—true lifts of -3% or -5%. If the policy frequently calls these negative results "winners," the threshold may be too low. If the policy correctly identifies them as neutral or negative most of the time, it is likely safe for business use.
-
Reversibility-Based Thresholds: Decisions that are hard to reverse, such as a complete backend migration or a fundamental pricing change, should maintain a high bar (90-95% confidence). Decisions that are "two-way doors," such as UI tweaks or promotional banners, can safely operate at a 70-80% confidence level.
-
Explicit Precision Tradeoffs: Organizations must move away from "binary" thinking (winner vs. loser) and toward "probabilistic" thinking. This requires documenting the expected precision of a policy. A team might state: "We accept a 75% precision rate to achieve a 50% increase in shipping velocity."
Industry Reactions and the Broader Impact
The shift toward more flexible statistical policies has met with mixed reactions from the traditional data community. Statistical purists argue that "peeking" at data and lowering thresholds inflates false positive rates to an indefensible degree. However, proponents of "Decision Science" argue that the goal of a business is to make the best decision possible with the available data, not to achieve a "textbook ideal" that requires 40 years of traffic to reach significance.

"The objection that a test is ‘underpowered’ is mathematically valid but often practically useless," says Andrea Bronzini, an experimentation expert. "If a power analysis says you need a million conversions to detect a 3% lift, but you only get 500 a month, the answer isn’t to stop testing. The answer is to find a decision policy that works within your constraints."
As the digital economy becomes increasingly competitive, the ability to iterate quickly is becoming a primary differentiator. Companies that can successfully transition from "testing for certainty" to "testing for decision-making" are likely to see a compounding advantage in their growth metrics. By acknowledging the double standard of statistical confidence and designing deliberate policies to address it, businesses can finally break the cycle of inconclusive results and turn their experimentation programs into genuine growth engines.
Conclusion: From Research to Decision-Making
The evolution of A/B testing from a niche research tool to a core business function necessitates a change in how results are interpreted. The "inconclusive" label is often a symptom of a policy that values avoiding a small mistake over achieving a large gain. By adopting more realistic thresholds, simulating outcomes, and matching rigor to risk, organizations can ensure that their data serves their strategy, rather than standing in its way. The standard for experimentation should not be a fixed number inherited from the 1920s; it should be a conscious design choice that balances the cost of being wrong against the cost of doing nothing.