


The landscape of digital experimentation is currently facing a systemic crisis characterized by stagnant progress and a high frequency of "inconclusive" results that threaten the viability of data-driven programs. In corporate environments across the globe, product teams and growth marketers frequently encounter a recurring cycle: a bold variation is designed, traffic is allocated, and after a standard four-week duration, the testing platform reports a lack of statistical significance. This pattern often leads to a decline in creative risk-taking, as designers move away from ambitious ideas toward incremental changes, while stakeholders begin to question the return on investment for complex experimentation infrastructures.
Industry data suggests that this "inconclusive trap" is rarely a failure of the teams themselves but is instead a consequence of applying academic statistical policies to commercial environments. Many organizations have inherited decision-making frameworks designed for clinical trials or academic publishing—where the cost of a false positive is extremely high—and applied them to low-risk business decisions such as headline changes or UI adjustments. The result is a decision-making paralysis that favors safety over growth.

The Mechanics of Experimentation Failure
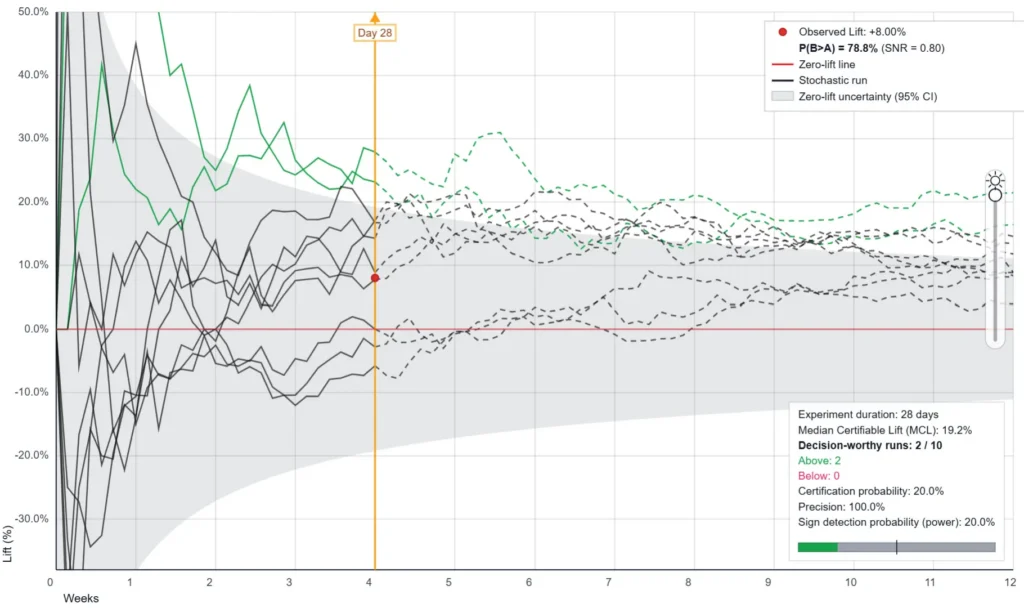
At the heart of the issue is the reliance on the standard 95% confidence interval (CI), a threshold that requires a high level of evidence before a "winner" can be declared. When an experiment reports a lift of +8%, practitioners often misinterpret this as a definitive statement of the variation’s superiority. However, in a stochastic environment, that +8% is merely a single observation from a wide distribution of possible outcomes. Depending on the noise within the data, the true underlying lift could be significantly higher or lower.
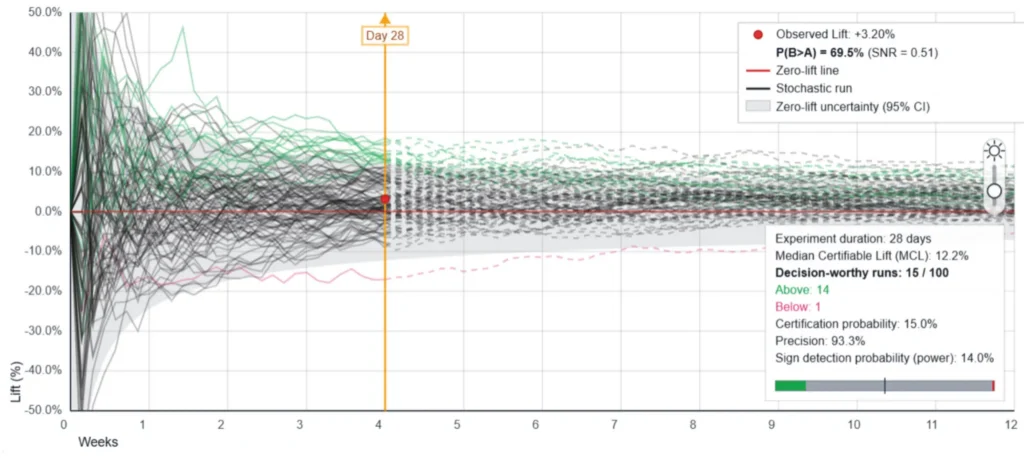
A recent analytical simulation utilizing a stochastic path model highlighted the severity of this problem. The simulation modeled a business collecting 500 conversions over a four-week period with a control conversion rate of 3% and a true underlying lift of +3.2%. Under a standard two-sided 95% confidence interval policy evaluated at the 28-day mark, only 15 out of 100 experiments reached a certification of success. The remaining 85 experiments returned inconclusive results despite a real, positive improvement being present in the underlying reality.
This 85% failure rate to detect a positive change is a direct result of a "median certifiable lift" (MCL) that is misaligned with the business’s traffic and expected effect sizes. In the aforementioned scenario, the policy required a true lift of at least 12.2% to have a 50% chance of certifying a winner. Because the actual lift was only 3.2%, the statistical "hurdle" was effectively impossible to clear for the vast majority of test runs.

The Organizational Double Standard in Risk Assessment
A significant point of friction identified by data analysts is the "double standard" applied to A/B testing compared to other business functions. In typical corporate operations, senior leaders regularly approve substantial investments based on much lower confidence thresholds. A Chief Marketing Officer might approve a $100,000 campaign based on creative intuition and market trends that suggest a 60% or 70% probability of success. Similarly, product teams frequently ship new features based on qualitative interviews and positive mockup feedback, representing an implicit confidence level far below the academic 95% standard.
When these same organizations pivot to A/B testing, they suddenly demand a two-sided 95% confidence interval, which mathematically equates to a 97.5% one-sided confidence level. This creates a scenario where the bar for an experiment is nearly 30 percentage points higher than the bar for a major marketing spend. This lack of calibration between risk and rigor leads to missed opportunities. While a 95% threshold protects against false positives, it does so at the extreme expense of "missed winners"—real improvements that are never implemented because they did not meet an arbitrarily high statistical bar.
Comparative Analysis: Standard CI vs. Signal-to-Noise Ratio (SNR)
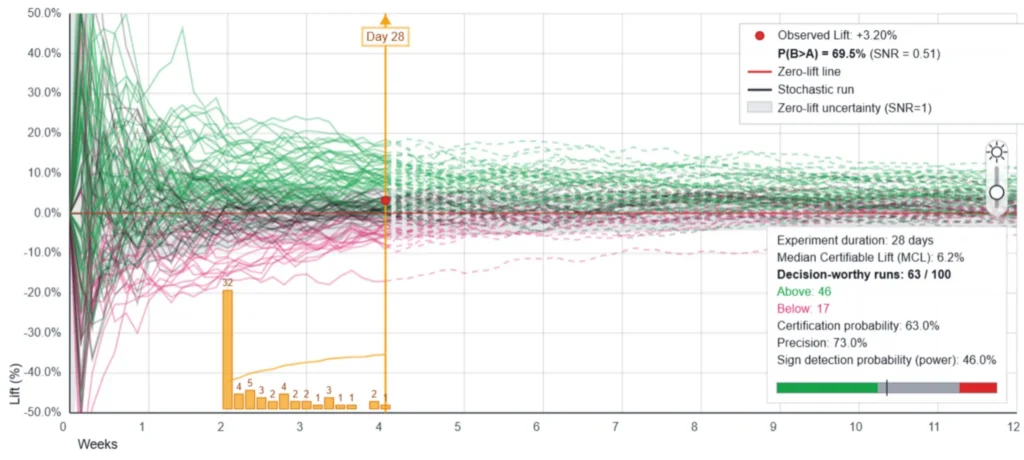
To address this imbalance, some experts are advocating for a shift toward decision policies based on Signal-to-Noise Ratio (SNR). SNR measures the ratio between the observed difference in conversion rates and the uncertainty (noise) surrounding that difference. An SNR of 1 represents the point where the signal is equal to the noise, corresponding to approximately 84% one-sided posterior probability that the variation is better than the control.
The impact of shifting from a 95% CI policy to an SNR=1 policy with continuous monitoring is profound. In the same simulation of a 3.2% true lift:
- Scenario 1 (95% CI): Correctly identified the winner in 15% of cases.
- Scenario 2 (SNR=1): Correctly identified the winner in 46% of cases.
This transition effectively triples the "sign detection probability," transforming an experimentation program from a source of inconclusive reports into a consistent growth engine. However, this velocity comes with a trade-off in precision. In the SNR=1 model, the precision—the likelihood that a certified winner is actually better than the control—dropped from 93.3% to 73%. This means that while the team ships significantly more winners, they also ship more "false positives" or neutral changes. For many businesses, shipping three real winners and one neutral change is a more profitable outcome than shipping one winner and ignoring six others.
Implementation Strategies for Growth-Oriented Policies
Transitioning to a more flexible experimentation policy requires a deliberate design phase before any tests are launched. Experts suggest that a "one-size-fits-all" approach to statistical rigor is outdated. Instead, the threshold should be matched to the reversibility and risk of the decision.
- Low-Threshold Decisions (High Reversibility): For changes that are easy to undo, such as headline tests, button colors, or minor UI tweaks, a lower threshold (e.g., SNR=1 or 80% confidence) is often appropriate. The cost of being wrong is low, and the benefit of moving quickly is high.
- High-Threshold Decisions (Low Reversibility): For decisions that are difficult to walk back, such as permanent changes to pricing structures, core brand identity, or complex backend logic, the standard 95% CI remains the appropriate safeguard.
- Use of Median Certifiable Lift (MCL): Rather than guessing an "Expected Lift" for power analysis, teams are encouraged to calculate their MCL based on their actual traffic and baseline conversion rates. If the MCL is 15% but the team typically sees 3% gains, the experiment is destined for an inconclusive result before it even begins. Knowing this allows the team to either increase the test duration or accept a lower confidence threshold to make the test viable.
Addressing the Statistical Purist Perspective
The shift toward lower thresholds and continuous monitoring often meets resistance from statistical purists who argue that "peeking" at data or lowering p-value requirements invalidates the integrity of the test. However, proponents of the "decision policy" approach argue that these critiques are based on a misunderstanding of business context.
In a business environment, the goal of an experiment is to make a "better-than-random" decision under constraints. The classical Neyman-Pearson power analysis is designed for a fixed-horizon environment with zero flexibility. In contrast, modern simulation-based policies incorporate the stopping rules into the policy itself. By running thousands of simulations, analysts can determine the exact false positive profile of a specific protocol, making the risks transparent and manageable.
Furthermore, the concept of "sign detection probability" is emerging as a more practical metric than "statistical power." While power is a narrow academic definition, sign detection probability represents the likelihood of certifying the correct direction of a true effect under any specified policy. This allows businesses to compare different operating behaviors—such as a 4-week fixed test versus a 2-week minimum with daily monitoring—and choose the one that maximizes expected value.
Broader Implications for Industry ROI
The move away from rigid academic standards toward calibrated business decision policies has the potential to revitalize the field of conversion rate optimization (CRO). When experimentation programs produce more "certified" results, team morale improves, and the perceived value of the data science department increases.
Analysts note that a program that identifies a winner every other experiment (as seen in the SNR=1 simulation) creates a positive feedback loop. Product managers can promise progress to stakeholders, and designers feel empowered to test bolder hypotheses. Conversely, a program that returns "inconclusive" 85% of the time eventually loses its funding and its influence within the organization.
The ultimate goal of business experimentation is not to achieve scientific "truth" in a vacuum, but to reduce uncertainty enough to make profitable decisions. By acknowledging the trade-offs between precision, velocity, and inconclusive results, organizations can design experimentation frameworks that serve their specific growth objectives rather than adhering to conventions that were never intended for the fast-paced digital economy. The transition from "Is this 95% certain?" to "Is this a sound business bet given the stakes?" represents a significant evolution in the maturity of data-driven organizations.







