

The modern digital commerce landscape is defined by a paradox where businesses possess more quantitative data than ever before, yet often remain disconnected from the qualitative motivations of their customers. While traditional analytics platforms provide a granular view of what users do—tracking clicks, scroll depth, and bounce rates—they frequently fail to explain the "why" behind these behaviors. To bridge this information gap, industry leaders are increasingly turning to strategic customer feedback surveys. These tools serve as a diagnostic layer, uncovering the specific friction points, doubts, and unmet expectations that prevent users from completing a purchase or continuing a subscription. By transforming vague feedback into actionable insights, organizations can systematically improve their conversion rate optimization (CRO) efforts and enhance long-term customer retention.
The Evolution of Qualitative Data in Digital Strategy
Historically, customer feedback was collected through broad, annual satisfaction surveys that often yielded low response rates and outdated information. However, the rise of "Zero-Party Data"—information intentionally and proactively shared by a consumer—has shifted the focus toward micro-surveys delivered at precise moments in the user journey. This shift is driven by a necessity to adapt to a privacy-centric web environment where third-party cookies are being phased out, making direct consumer input the most reliable source of truth for marketing and product teams.
Chronology of the Customer Feedback Integration Process
The implementation of a modern feedback strategy typically follows a structured timeline designed to identify and then mitigate conversion barriers:
- The Identification Phase: Analysts review quantitative data (e.g., Google Analytics 4) to identify high-drop-off pages, such as product detail pages (PDPs) or the initial checkout step.
- The Hypothesis Phase: Based on the location of the drop-off, teams hypothesize potential friction points—such as lack of trust, pricing concerns, or technical errors.
- The Deployment Phase: Specific, high-intent survey templates are triggered based on user behavior (e.g., exit-intent pop-ups or post-purchase redirects).
- The Analysis Phase: Qualitative responses are categorized into themes, often using natural language processing (NLP) to identify recurring keywords.
- The Iteration Phase: Insights are translated into A/B tests or UX changes, such as updating FAQ sections, simplifying checkout fields, or refining the onboarding sequence.
Addressing Product Page Friction and User Hesitation
A significant portion of ecommerce revenue is lost at the product page level. According to the latest research from the Baymard Institute, approximately 52% of desktop sites and 62% of mobile sites currently provide a "mediocre" or poor product page user experience (UX). When a shopper reaches a product page but fails to add an item to their cart, it is rarely a matter of low traffic quality. Instead, it is usually indicative of unanswered questions.
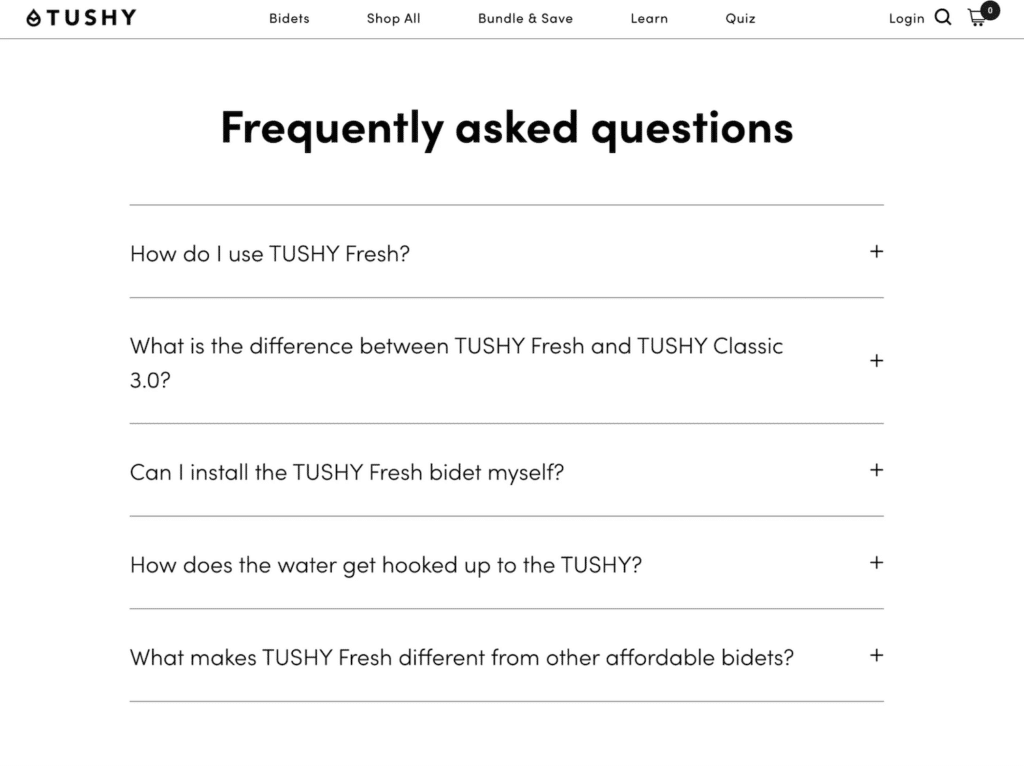
Research suggests five primary drivers of product page abandonment: concerns regarding product fit or compatibility, lack of clarity on shipping costs or delivery timelines, insufficient social proof, technical bugs, or a lack of trust in the brand’s return policy. Brands like TUSHY have successfully mitigated these issues by integrating frequently asked questions (FAQs) directly onto the product page, addressing installation and compatibility concerns before the user feels the need to leave the site to seek information.
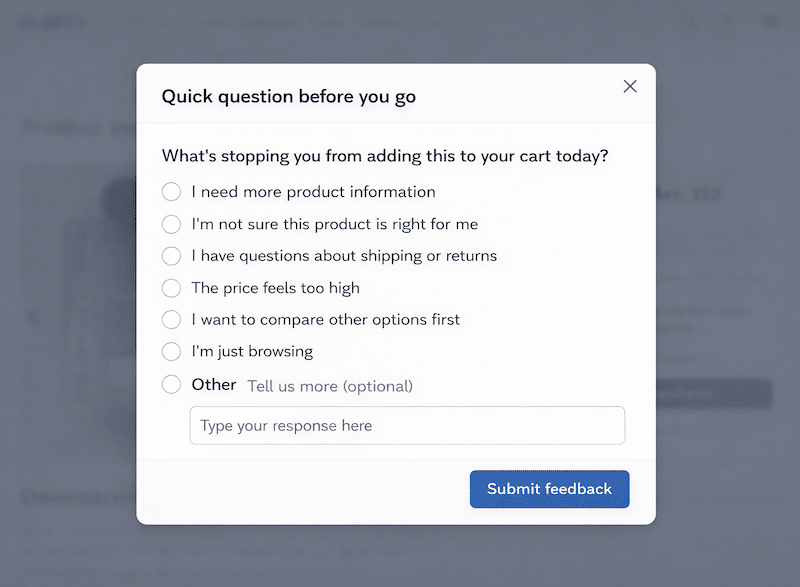
The most effective diagnostic question for this stage is: "What’s stopping you from adding this to your cart today?" By providing multi-choice options—such as "I’m worried about the fit" or "Shipping is too expensive"—brands can collect structured data that is easier to analyze than open-ended text boxes.
Analyzing the Psychology of Checkout Abandonment
The transition from "add to cart" to "purchase complete" is the most critical juncture in the ecommerce funnel. Baymard’s 2024 benchmarks indicate that the average cart abandonment rate stands at 70.19%. This suggests that even when intent is high, friction can easily derail the transaction.
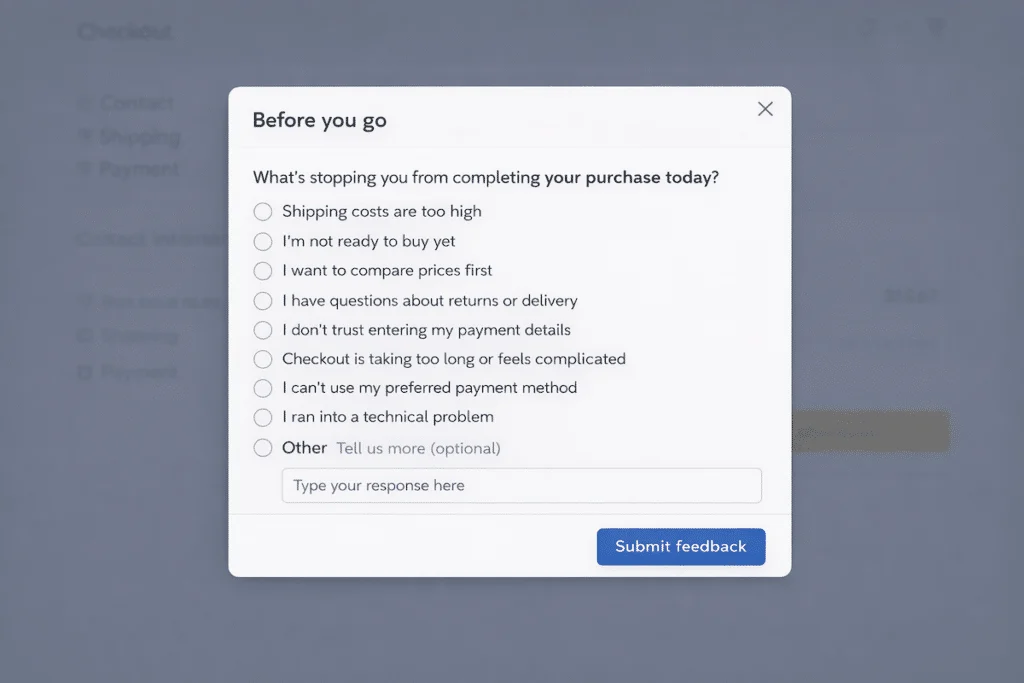
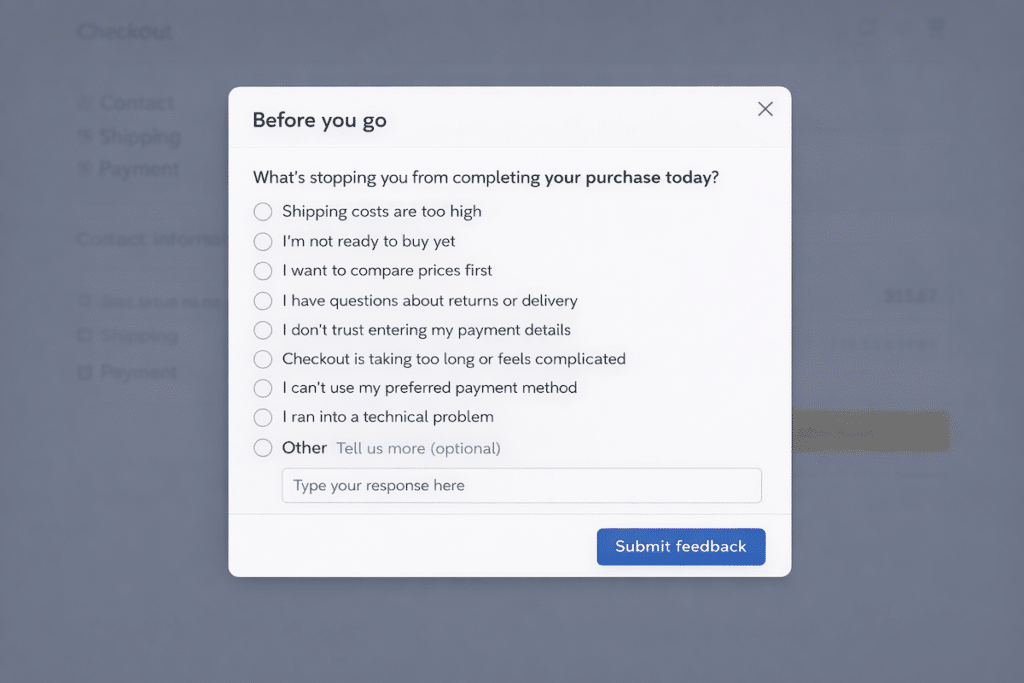
Official data from industry leaders like Shopify suggests that shoppers abandon checkout when the process feels restrictive or when unexpected costs appear. Common triggers include the requirement to create an account, slow delivery estimates, or a lack of preferred payment methods. To counter this, businesses deploy checkout abandonment surveys that trigger upon exit-intent. By asking, "What’s stopping you from completing your purchase today?" companies can identify if the issue is a "surprise" cost (like taxes or shipping) or a technical failure. Analysis shows that addressing these specific barriers can lead to immediate lifts in conversion without requiring changes to the product or pricing itself.
The Rise of Post-Purchase Attribution and Motivation
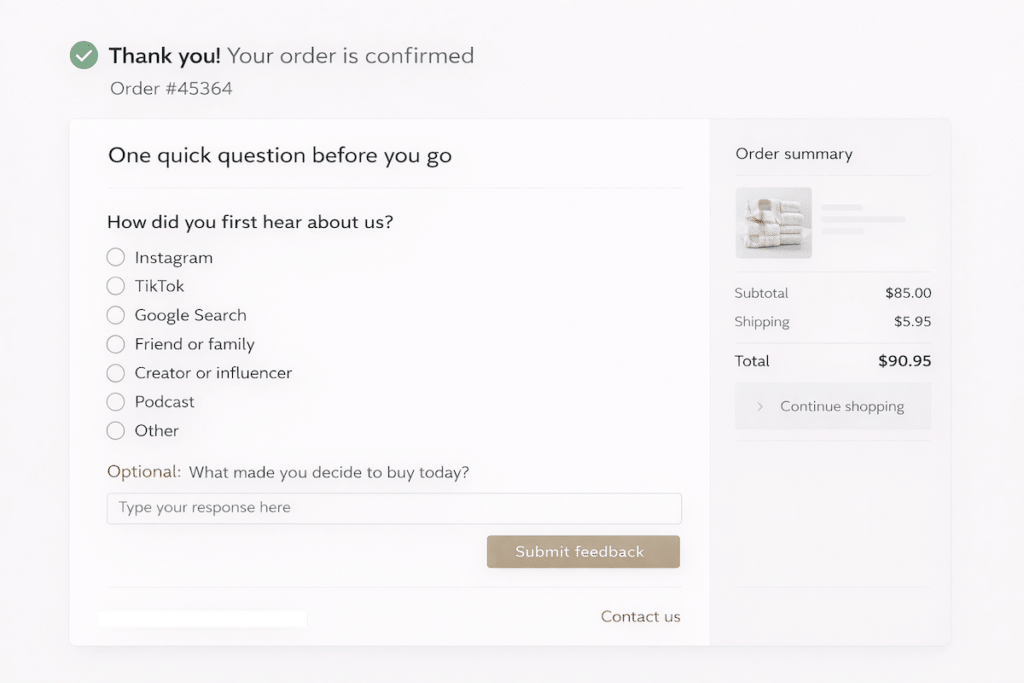
In an era of fragmented marketing channels, understanding what truly drives a sale is increasingly difficult. Post-purchase surveys have emerged as a vital tool for attribution. While digital tracking may credit the "last click" (often a search ad or an email), the actual discovery of the brand might have happened through a podcast, an influencer, or word-of-mouth.
A notable case study involves the brand Weezie, which utilized a post-purchase survey to discover that 35% of its business was driven by word-of-mouth. This insight allowed the brand to reallocate budgets away from underperforming paid channels and toward community-building initiatives. The standard industry question for this stage—"How did you first hear about us?"—is now considered essential for accurate media mix modeling.
SaaS Activation and the 14-Day Retention Crisis
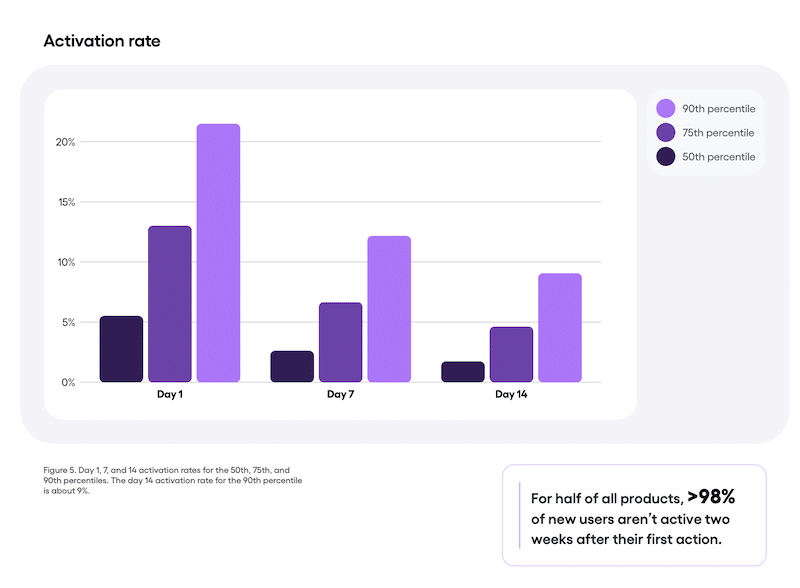
For Software-as-a-Service (SaaS) companies, the challenge is not just the signup, but the "activation"—the moment a user realizes the value of the product. Data from Amplitude’s Product Benchmark Report reveals a stark reality: by day 14 of a trial, the median product retains only 2% of its new users. Even top-tier products rarely exceed a 9% retention rate at this stage.
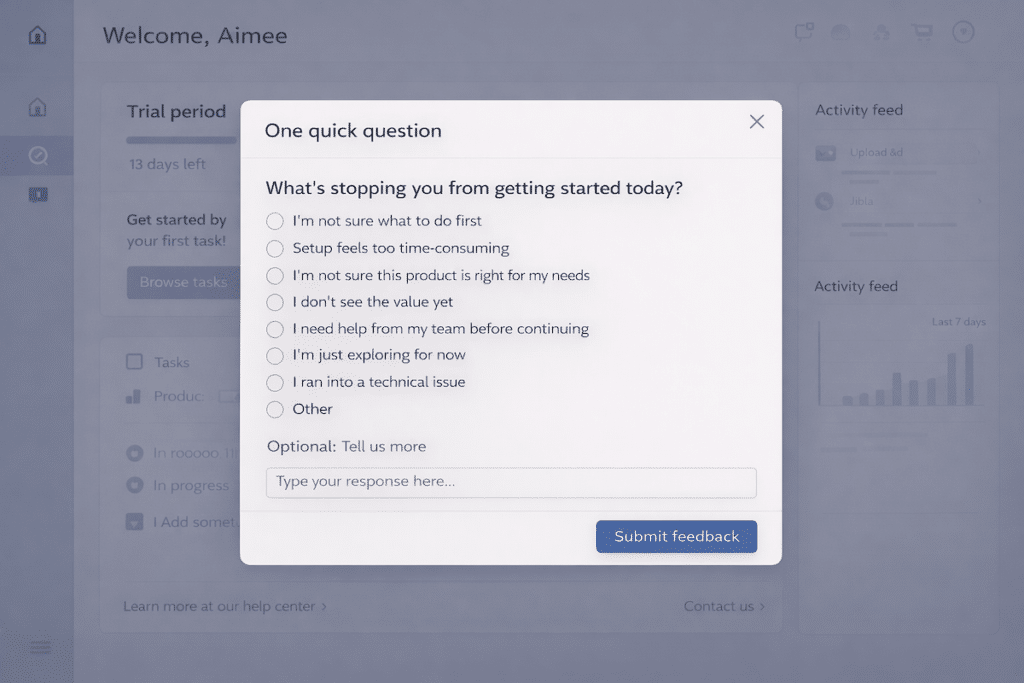
This rapid drop-off is often attributed to a "Time to Value" (TTV) that is too long. If a user signs up but does not activate, they likely found the setup too complex or failed to understand the product’s core utility. Surveys triggered during the trial period—asking "What’s stopping you from getting started today?"—allow product teams to identify if they need better onboarding tutorials, simplified integrations, or more proactive customer support.
The Economics of Returns and Cancellations
Retention is the primary driver of profitability in mature business models. The National Retail Federation (NRF) projected that 16.9% of annual sales would be returned in 2024, with that figure expected to rise to 19.3% for online sales in 2025. These returns represent a massive logistical cost and a loss of customer lifetime value (LTV).
Surveys administered during the return or cancellation process are essential for understanding expectation mismatches. Research from PowerReviews indicates that "poor fit" is the most common reason for retail returns. If a brand sees a spike in "item didn’t match description" responses, it serves as an immediate signal to update product photography or descriptions. In subscription models, reasons for cancellation—such as "too expensive" or "don’t use it enough"—provide the data necessary to offer "save" discounts or to adjust product development priorities.
Best Practices for Survey Design and Data Integrity
To ensure that customer feedback is statistically significant and useful for CRO, researchers emphasize several key principles:
- Specificity Over Breadth: Broad questions like "How was your experience?" produce vague data. Specific questions like "Is there anything missing from this page?" yield actionable insights.
- Low Friction Formats: Using radio buttons or multi-choice options for the initial question increases response rates. An optional text field can be provided for those who wish to elaborate.
- Strategic Timing: Surveys should be triggered by behavior (e.g., 30 seconds of inactivity or exit-intent) rather than appearing immediately upon page load, which can annoy the user and increase bounce rates.
- Objective Analysis: Teams should avoid "confirmation bias" by looking for patterns in the data rather than cherry-picking comments that support existing beliefs.
Broader Impact and Industry Implications
The integration of qualitative feedback into the CRO process marks a shift toward more empathetic and user-centric business models. As AI and machine learning become more prevalent, the ability to analyze thousands of open-ended survey responses in real-time will allow businesses to become more agile.
Industry analysts suggest that companies that prioritize direct customer feedback will be better positioned to navigate economic volatility. By understanding the specific anxieties of their audience—whether related to price sensitivity, shipping speed, or product quality—organizations can make data-backed decisions that protect their margins and build deeper customer loyalty. In the long term, the brands that "listen" to the why behind the data will consistently outperform those that only "watch" the what.







