The persistent discrepancy between A/B testing platforms and Google Analytics 4 has long been a source of friction for data scientists, conversion rate optimization (CRO) specialists, and digital marketers. While minor variations in data are expected in any multi-tooled environment, significant gaps often lead to questions regarding the integrity of experiment results and the reliability of multi-million dollar business decisions. Industry benchmarks generally suggest that a variance of up to five percent in bottom-of-funnel conversion tracking—such as purchases, lead generations, or trial sign-ups—is acceptable. However, when these figures diverge by ten percent or more, the root cause frequently extends beyond simple configuration errors to the fundamental mechanics of how data is transmitted over global networks.
The Technical Foundation of Data Discrepancy
To understand why data mismatches occur, one must first examine the architectural differences between specialized testing scripts and general analytics frameworks. A/B testing tools, such as Convert Experiences, are typically designed to execute synchronously within the <head> tag of a website’s HTML. This placement ensures that the script fires the moment a page begins to load, allowing the tool to "bucket" a visitor into a specific variation before the content is rendered, thereby preventing the "flicker effect."
In contrast, Google Analytics 4 (GA4) operates primarily on an asynchronous model. While this approach is beneficial for page load speeds and Core Web Vitals, it places the analytics beacon in a queue behind other browser tasks. Consequently, the firing of a GA4 event is contingent upon the browser’s available resources and the stability of the user’s network connection. This fundamental difference creates a "timing window" where a testing tool may record a visitor who leaves the site before the GA4 script has the opportunity to initialize and transmit data.
Chronology of Investigation: Two Years of Empirical Research
The realization that network conditions serve as a primary driver of data loss is the result of an extensive research period conducted between 2023 and 2025. During this time, technical teams at Convert Experiences performed a deep-dive analysis into GA4 implementations across dozens of live enterprise environments. The research focused on simulating "real-world" browsing conditions, moving beyond the idealized high-speed fiber connections found in corporate offices.
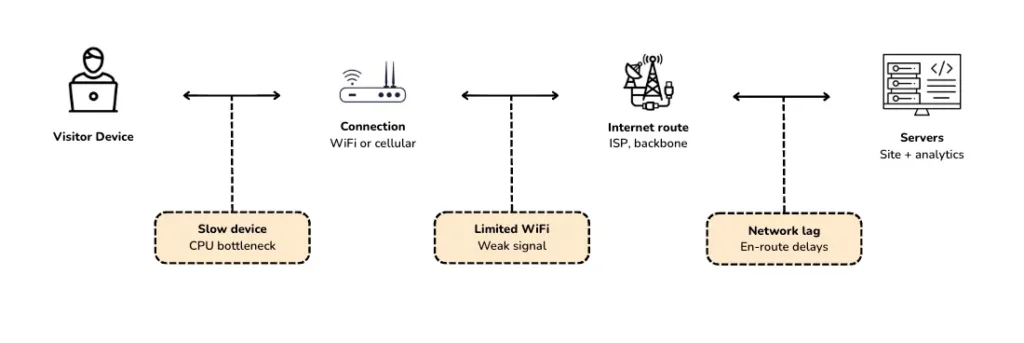
The methodology involved testing site performance under various throttled network speeds, including slow 3G and congested 4G LTE environments. Analysts monitored how GA4 handled event queuing when device CPU usage was high—a common scenario for users on older mobile devices or those with multiple browser tabs open. The findings revealed that the "drift" in data was not a random occurrence but followed a predictable pattern tied to the physical limitations of the user’s hardware and connectivity.
Supporting Data: The Reality of Global Connectivity
Despite the proliferation of 5G technology, the global landscape of mobile connectivity remains fragmented. According to data from the 2025 CTIA report on cellular demand, only approximately 50 percent of mobile connections in the United States are currently utilizing 5G networks. The remainder continues to rely on LTE or older standards. Furthermore, research from Opensignal indicates that even users with 5G-capable devices often spend significant portions of their browsing time on 4G networks due to signal penetration issues in buildings or rural areas.
This data is critical because GA4’s performance degrades significantly as network latency increases. In controlled tests, researchers observed that under slow network conditions, the initial page_view event in GA4 frequently suffered a delay of 20 seconds or more. For a significant portion of web traffic, 20 seconds exceeds the total duration of a site visit. If a user enters a site, skims the content, and navigates away within 15 seconds, the A/B testing tool (which fired instantly) will record the session, while GA4 will show no record of the user ever existing.
The Signature of Network-Induced Data Loss
Analysis of funnel data provides a distinct "signature" that allows organizations to diagnose network-related issues. If data loss were caused by a broken integration or a general configuration error, the discrepancy would typically be uniform across all stages of the conversion funnel. For example, if the testing tool showed 10 percent more users than GA4, it would likely also show 10 percent more "add-to-cart" events and 10 percent more purchases.
However, network-induced loss presents a non-linear funnel shape. The largest gaps appear at the very top of the funnel (initial entry) and the very bottom (the final conversion). The middle of the funnel—events like viewing a product category or interacting with a filter—often shows much higher alignment between tools.
This phenomenon occurs because visitors who successfully trigger mid-funnel events have, by definition, remained on the site long enough for the initial loading bottleneck to clear. Once the GA4 script has finally loaded and the session is established, subsequent events fire with relative reliability. The "missing" users are those who dropped off during the initial 20-second window, which skews the conversion rate denominator and results in an undercount of total sessions in the analytics platform.
Professional Responses and the "GTM Trap"
Digital analytics experts have frequently debated the best practices for tag firing sequences. A common recommendation within the Google Tag Manager (GTM) community has been to fire analytics tags on the "Window Loaded" trigger rather than the "Page View" trigger to improve site performance scores.

However, professional analysis suggests this creates a strategic trade-off. While waiting for the window to fully load improves Core Web Vitals, it exponentially increases the risk of missing session data on slower networks. By the time the "Window Loaded" event triggers, a mobile user on a flaky connection may have already lost patience and exited the browser. This highlights a growing tension in the industry between optimizing for search engine algorithms (speed) and optimizing for data integrity (completeness).
Ryan Levander, a prominent voice in the A/B testing space, argues that practitioners should move away from the pursuit of "perfect" accuracy. Instead, the focus should be on trend analysis. If both tools show the same variation is winning by a similar margin, the experiment’s conclusion is likely valid, even if the raw numbers do not match.
A Protocol for Diagnosing Discrepancies
For organizations facing a variance greater than 15 percent, a standardized diagnostic protocol is recommended to isolate the cause.
First, analysts must ensure they are comparing "Users" in GA4 to "Visitors" in the testing tool. Comparing GA4 "Sessions" to testing "Visitors" is a common error; because a single visitor can have multiple sessions, this creates an artificial gap that complicates the investigation.

Second, the data must be segmented by device category. If the discrepancy is negligible on desktop but substantial on mobile, network conditions are the confirmed culprit. High-performance desktop computers on stable wired connections rarely experience the 20-second firing delays seen on mobile devices.
Third, organizations should audit their GTM triggers. Moving the GA4 configuration tag to the earliest possible trigger—typically "Initialization" or "Page View"—can mitigate some of the loss, albeit at a minor cost to perceived load speed.
Finally, cross-referencing client-side data with server-side logs remains the "gold standard" for verification. Server-side data does not rely on the browser’s ability to execute JavaScript or maintain a stable connection during the load sequence. If the testing tool’s numbers align more closely with the server-side backend (such as a CRM or an order management system) than they do with GA4, it confirms that the analytics platform is failing to capture the full scope of the audience due to client-side environmental factors.
Broader Impact and Industry Implications
The implications of network-driven data loss extend far beyond the realm of A/B testing. As the web becomes increasingly reliant on heavy JavaScript frameworks and complex third-party tracking stacks, the "analytics gap" is likely to widen. For businesses, this means that conversion rates reported in GA4 may be artificially inflated because the "denominator" (the total number of users) is being undercounted.

Furthermore, this issue raises questions about the future of attribution. If a significant portion of mobile traffic is not being recorded during the initial seconds of a visit, the "first-touch" attribution for those users may be lost entirely. As privacy regulations like GDPR and CCPA continue to restrict the use of cookies, and as browser technologies like Apple’s Intelligent Tracking Prevention (ITP) limit the lifespan of client-side identifiers, the industry is seeing a decisive shift toward server-side GTM and server-side testing.
By moving the tracking logic from the user’s browser to a cloud server, companies can bypass the limitations of flaky mobile networks and slow device CPUs. While more complex to implement, server-side solutions offer a level of data parity that client-side scripts can no longer guarantee in an increasingly mobile-first world. In the interim, understanding the "signature" of network loss allows brands to interpret their GA4 and A/B testing data with the necessary context, ensuring that strategic decisions are based on patterns and trends rather than a futile search for identical numbers.