The landscape of data analytics and reporting underwent a significant transformation as organizations transitioned from static, spreadsheet-based documentation to dynamic, interactive visualizations. At the forefront of this shift was Google Data Studio, a tool that, by 2018, had moved beyond its nascent stages to become a cornerstone for both corporate business intelligence and data journalism. The platform’s ability to bridge the gap between complex data processing and accessible visual storytelling allowed users to transform raw metrics into actionable insights and compelling narratives. This evolution reflected a broader industry trend toward data democratization, where the power to analyze and present information was no longer confined to specialized data scientists but was made available to marketers, journalists, and business analysts alike.
The Chronological Ascent of Google Data Studio
Google Data Studio was first introduced in mid-2016 as part of the Google Analytics 360 Suite, a premium enterprise offering. However, the true catalyst for its widespread adoption was the subsequent release of a free version, which allowed individuals and small-to-medium enterprises (SMEs) to experiment with its capabilities. Throughout 2017, Google aggressively expanded the platform’s features, introducing essential connectors for BigQuery, Google Sheets, and AdWords, as well as community-driven features that allowed for greater customization.
By the start of 2018, the tool had reached a level of maturity that enabled it to compete with established business intelligence (BI) players like Tableau and Microsoft Power BI, particularly for users already integrated into the Google Cloud ecosystem. The year 2017 served as a foundational period where the community began to move past simple bar charts, exploring complex layouts, interactive filters, and advanced data blending. This period marked the transition of Data Studio from a simple reporting tool to a sophisticated environment for narrative-driven visualization.
Revolutionizing Business Intelligence: Case Studies in Efficiency
The primary utility of Google Data Studio within the corporate sector has been the automation of reporting and the enhancement of clarity in performance tracking. Traditional business reporting often suffered from "data silos" and the "manual labor trap," where analysts spent more time aggregating data than analyzing it.

Automated SEO Reporting at Boat International Media
A primary example of efficiency gains was documented by Boat International Media, a high-end luxury lifestyle brand. Before adopting Data Studio, the company’s monthly SEO reporting process was a labor-intensive endeavor that required approximately five business days to complete. The process involved manual data extraction from various sources, including Google Search Console and Google Analytics, followed by manual formatting in presentation software.
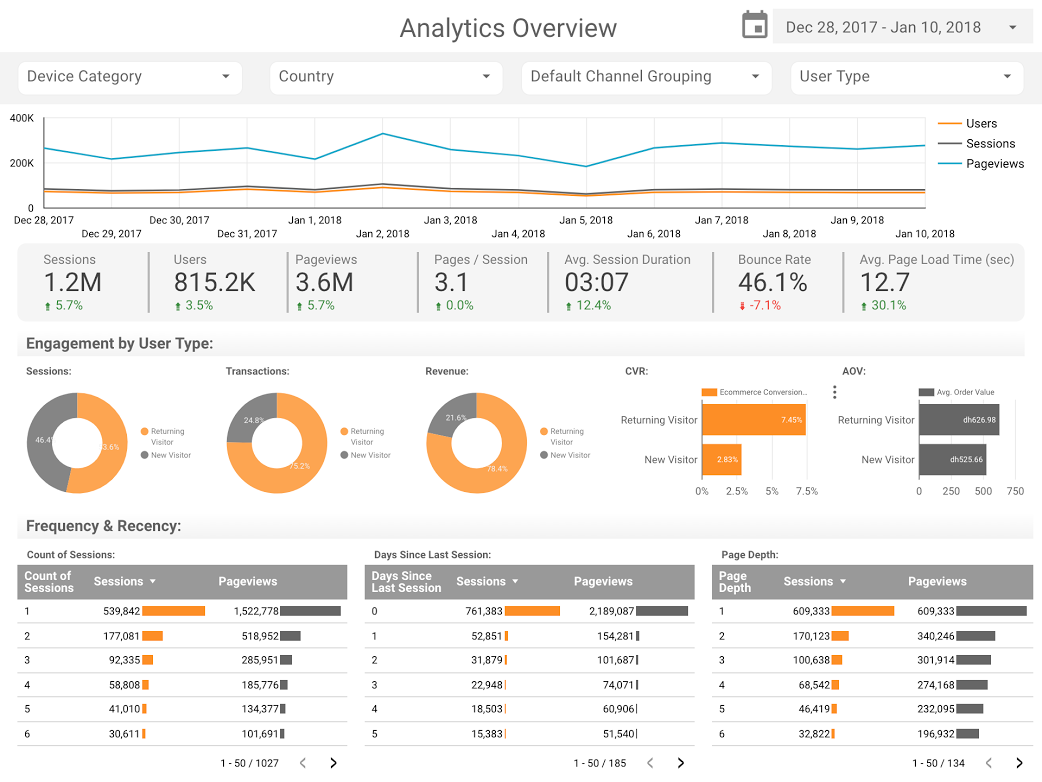
By leveraging Data Studio’s native connectors, the team reduced this five-day ordeal to a fifteen-minute automated refresh. This 99% reduction in time expenditure allowed the digital team to focus on strategic adjustments rather than clerical data entry. The resulting dashboards were designed with a "PDF-first" mentality, ensuring that the visualizations were clean enough for executive-level presentations while maintaining the interactivity required for deep-dive analysis. This case study highlights a critical shift in the industry: the value of an analyst is increasingly measured by their insights, not their ability to copy and paste data.
Benchmarking and Performance Metrics
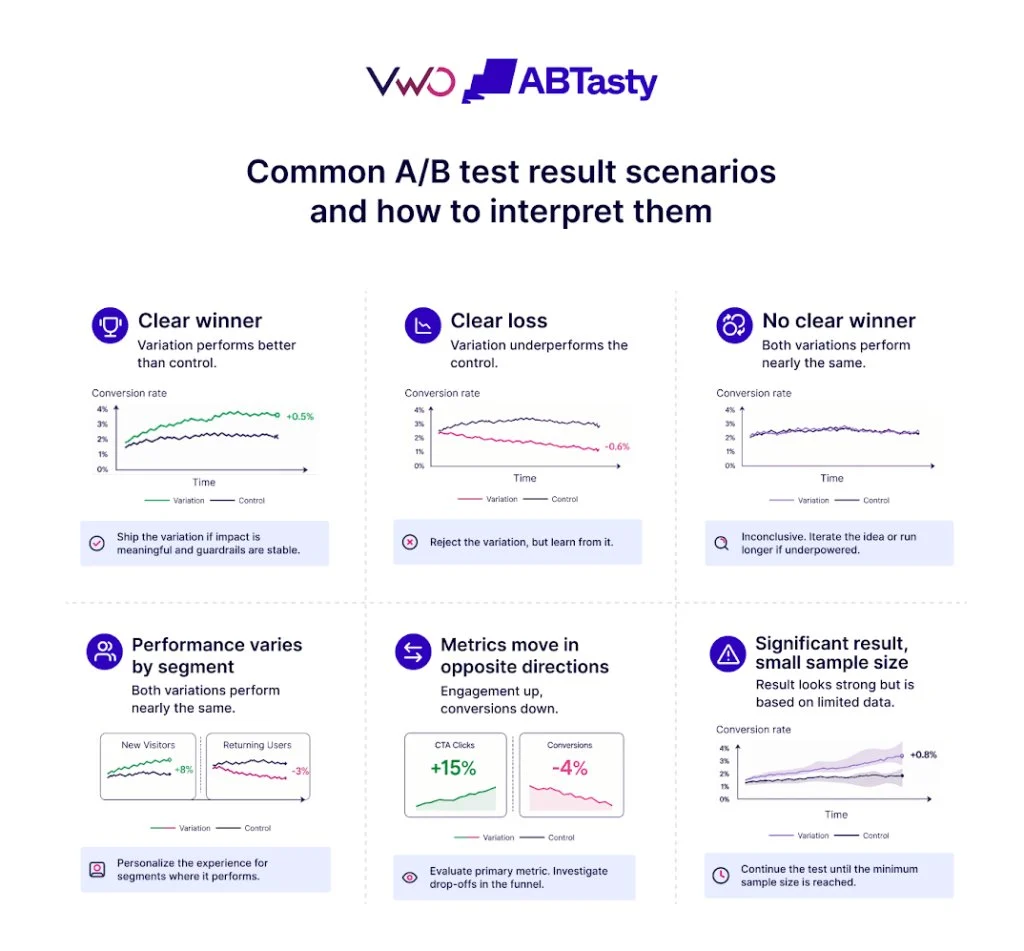
Other organizations, such as Analytics Pros, utilized Data Studio to solve the problem of contextualizing performance. Standard dashboards often show current metrics in a vacuum, making it difficult to determine if a number is "good" or "bad." By implementing bullet charts, the team was able to display current page-level engagement alongside two critical benchmarks: the previous year’s performance and the current year’s targets. This three-layered approach provided an immediate visual cue regarding progress, allowing stakeholders to identify underperforming segments at a glance.
Data Journalism: Bridging the Gap Between Information and Engagement
Beyond the boardroom, Data Studio emerged as a powerful tool for data journalism. The ability to embed interactive reports into articles allowed publishers to provide a more immersive experience for readers. Journalists began using the platform to explore cultural, social, and technological trends, often utilizing public datasets to uncover hidden stories.
Analyzing the Open Source Ecosystem
One of the most technically significant visualizations of 2017 came from Felipe Hoffa, a Developer Advocate at Google. Hoffa utilized the BigQuery connector to analyze GitHub’s massive "PushEvent" dataset. The goal was to identify which organizations and individuals contributed most significantly to open-source software.

The scale of this data is immense; GitHub generates millions of events daily. By processing this through BigQuery and visualizing it in Data Studio, Hoffa demonstrated how cloud-native tools could handle "big data" storytelling without the need for local processing power. The findings revealed the dominance of major tech firms in the open-source space, providing a factual basis for discussions regarding the corporate influence on software development.
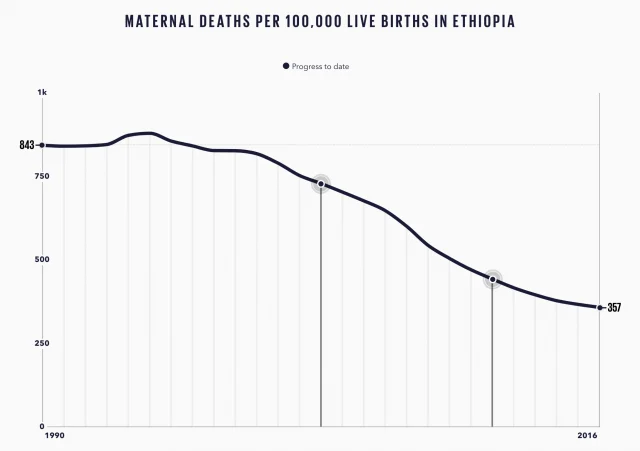
Social Trends: A Century of Marriages and Divorces
In a different application of the tool, analysts Lizzie Silvey and her colleagues used Data Studio to visualize 150 years of marriage and divorce trends in the United Kingdom. This project moved away from real-time business metrics to longitudinal social analysis. By mapping historical data from the Office for National Statistics (ONS), the visualization illustrated how external factors—such as changes in legislation (e.g., the Divorce Reform Act of 1969) and major global events like World War II—directly impacted social structures.
This type of "data story" serves as a bridge between academic research and public consumption. The interactivity of the dashboard allowed users to ask their own questions: How did divorce rates change when women gained more legal rights? What happens to marriage rates during economic downturns? The ability for the audience to "play" with the data fosters a higher level of engagement and trust in the reporting.
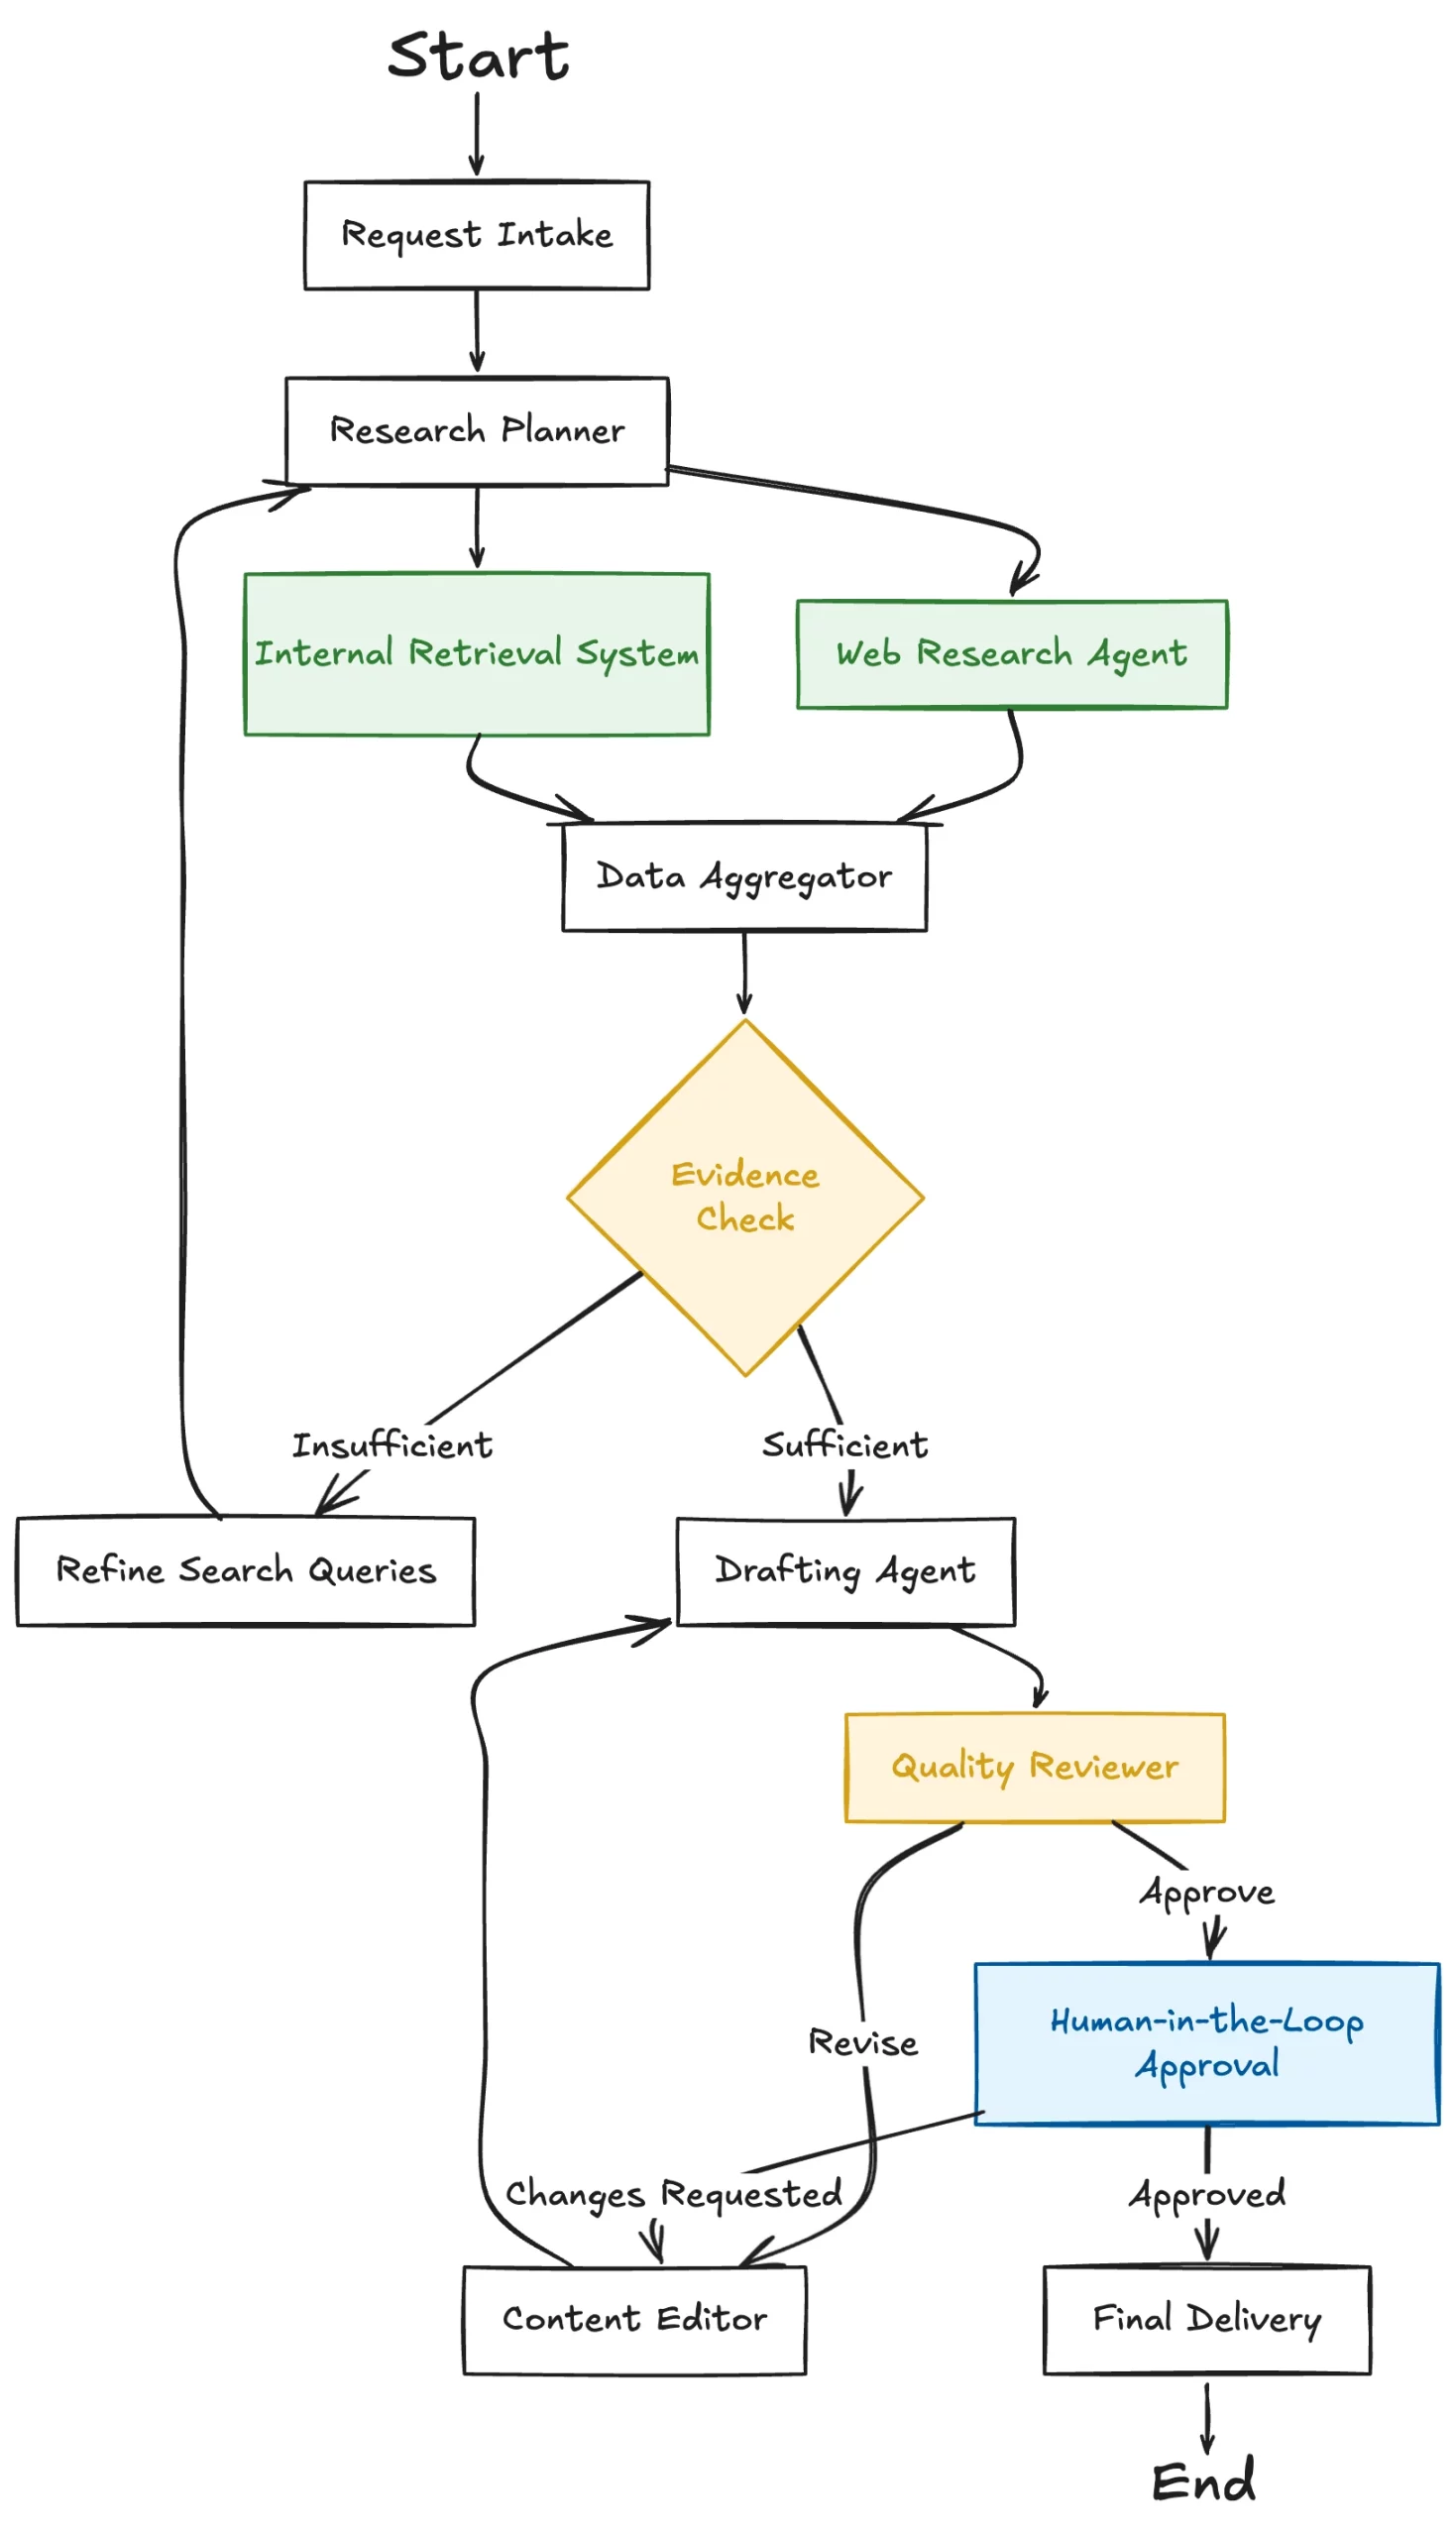
Technical Implications and the Role of Data Connectors
The versatility of Google Data Studio is largely attributed to its connector architecture. Unlike traditional BI tools that often require complex ETL (Extract, Transform, Load) processes, Data Studio allows for direct "live" connections to data sources.
- Google Analytics and AdWords: These native connectors allow marketers to see real-time campaign performance.
- BigQuery: This allows for the visualization of petabyte-scale datasets, making it a favorite for data engineers.
- Community Connectors: Introduced in late 2017, these allowed third-party developers to build bridges to non-Google services like Facebook Ads, LinkedIn, and Twitter, effectively making Data Studio a centralized hub for all digital marketing data.
The impact of these connectors cannot be overstated. They eliminated the "data lag" that often plagued decision-making processes. In a journalistic context, they allowed for "living" stories that updated automatically as new data became available.
Broader Impact and Professional Reactions
The industry’s reaction to the rise of Data Studio has been largely positive, though not without critique. Professional data analysts have noted that while the tool is excellent for visualization, it initially lacked some of the deep statistical modeling capabilities found in specialized software like R or Python. However, the consensus among digital agencies and newsrooms is that the tool’s ease of use and "shareability" outweigh its early limitations.
Experts in the field of User Experience (UX) have praised the platform for its intuitive drag-and-drop interface. This lowered the barrier to entry for "data-adjacent" professionals. As one consultant from E-Nor noted, the ability to create a compact, clear, and interactive presentation from complex Google Analytics data changed the nature of the client-agency relationship. Clients no longer received static reports that were outdated by the time they were read; they received "analytics cockpits" that provided real-time visibility into their investments.
Conclusion: The Future of Visual Communication
The examples from 2017 and early 2018 demonstrate that Google Data Studio is more than just a reporting tool; it is a medium for communication. Whether used to track SEO performance for a luxury media brand, compare the box office success of cinematic universes like Marvel and DC, or analyze a century of social change, the platform emphasizes clarity and accessibility.
As the industry moves further into an era defined by data ubiquity, the ability to synthesize and present that data will remain a critical skill. The evolution of Data Studio suggests a future where data is not just something to be stored in a database, but a narrative to be told. The democratization of these tools ensures that the power of data-driven storytelling is available to anyone with a story to tell and the curiosity to explore the numbers behind it. For businesses and journalists alike, the message is clear: the era of the static report is over, and the era of the interactive insight has begun.