
The global landscape of digital experimentation has reached a significant inflection point in 2026, characterized by a stark divide between a small elite of high-performing organizations and a vast majority of websites that remain static. Data indicates that less than 0.2% of all active websites currently utilize structured A/B testing or experimentation platforms. While the total number of active websites globally is estimated to be between 1.1 and 1.2 billion, only approximately 2.2 million sites are identified as using client-side testing technologies such as Convert, Optimizely, or VWO. This exclusivity highlights a massive untapped opportunity for conversion rate optimization (CRO) across the broader internet, even as the top tier of the market becomes increasingly sophisticated.

The Adoption Gap and Industry Concentration
The adoption of experimentation tools is inextricably linked to traffic volume and business model maturity. Among the top 10,000 websites by traffic, adoption of A/B testing or personalization platforms stands at 32%. This figure drops to 20.95% for the top 100,000 sites and falls further to 11.5% for the top one million. Analysts suggest that these figures may underrepresent the true scale of testing among enterprise-level entities, as many large-scale organizations have shifted toward server-side testing or proprietary custom platforms that are difficult for external tracking tools like BuiltWith to detect.
Industry-specific data reveals that experimentation is most deeply embedded in sectors where digital performance is the primary driver of revenue. Retail and E-commerce lead the sector with 27% of all practitioners, followed by Technology and SaaS at 23%, and Finance and Insurance at 13%. These industries prioritize metrics such as Average Order Value (AOV), Lifetime Value (LTV), and Monthly Recurring Revenue (MRR). In these environments, data analysis is typically integrated into the corporate culture at all levels, allowing these firms to outpace competitors through continuous, incremental improvements.

The Evolution of Experimentation Maturity
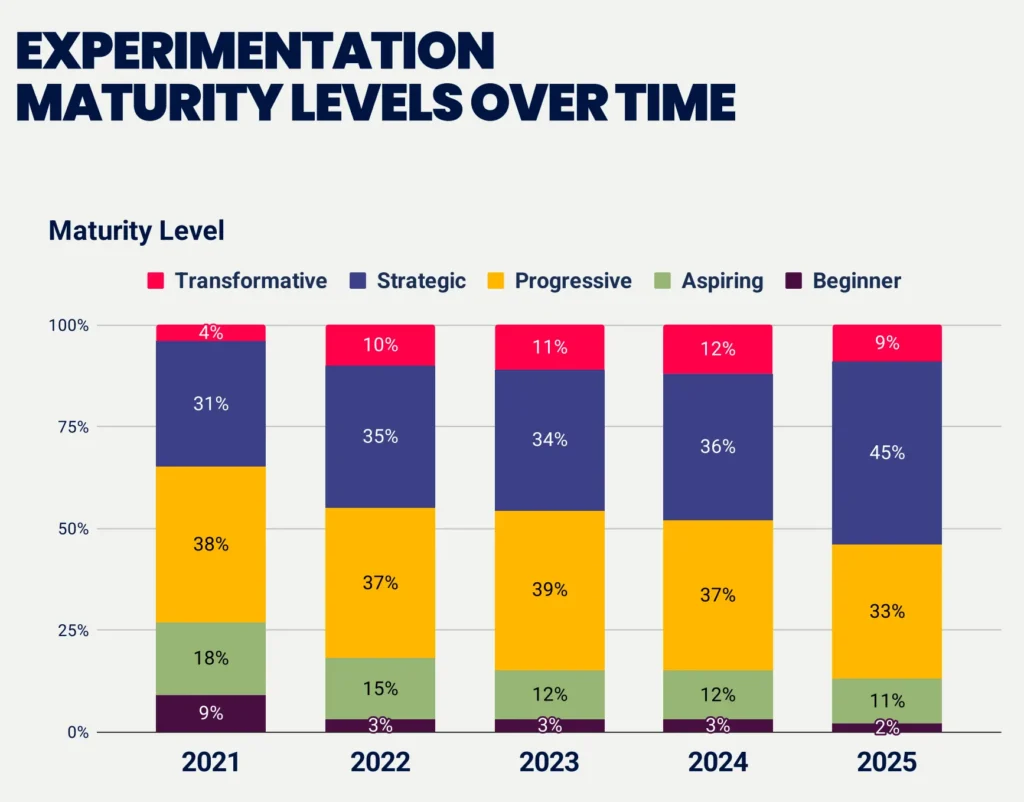
The maturity of experimentation programs has seen a dramatic shift over the last five years. In 2021, only 35% of companies were classified as operating at "strategic" or "transformative" levels. By 2025, that figure rose to 54%, according to the Experimentation Maturity Program Report. This trend signifies that the "progressive middle" is shrinking as companies either commit to high-level data-driven cultures or remain stuck in the beginner phase. Notably, the number of "beginners" has plummeted from 9% to just 2%, suggesting that the barrier to entry is no longer the tools themselves, but the organizational willpower to scale.
Despite this progress, achieving a "transformative" status remains rare, with only 10% of companies reaching this peak. Transformative programs are defined by executive sponsorship, cross-team collaboration, and a transparent culture of sharing learnings. Conversely, 33% of companies at the beginner level have been testing for less than a year, and 67% of those in the bottom tier lack a formal system for tracking how long their programs have even existed. This lack of formalization often leads to a "bottleneck" where management fails to see sufficient Return on Investment (ROI) to justify further funding, causing programs to stagnate or rely on "gut feelings" for decision-making.
Technical Methodologies and Statistical Rigor
Standard A/B testing remains the dominant methodology, accounting for 67.6% of all experiments conducted in 2025 and early 2026. Split URL testing, often used for major structural overhauls or redesigns, holds a 16.9% share. In contrast, Multivariate Testing (MVT) has fallen to less than 1%, largely due to the immense traffic requirements needed to achieve statistical significance across multiple variables. Personalization experiments account for 4.6% of the total, appearing as a natural progression for teams that have already established a repository of winning insights.
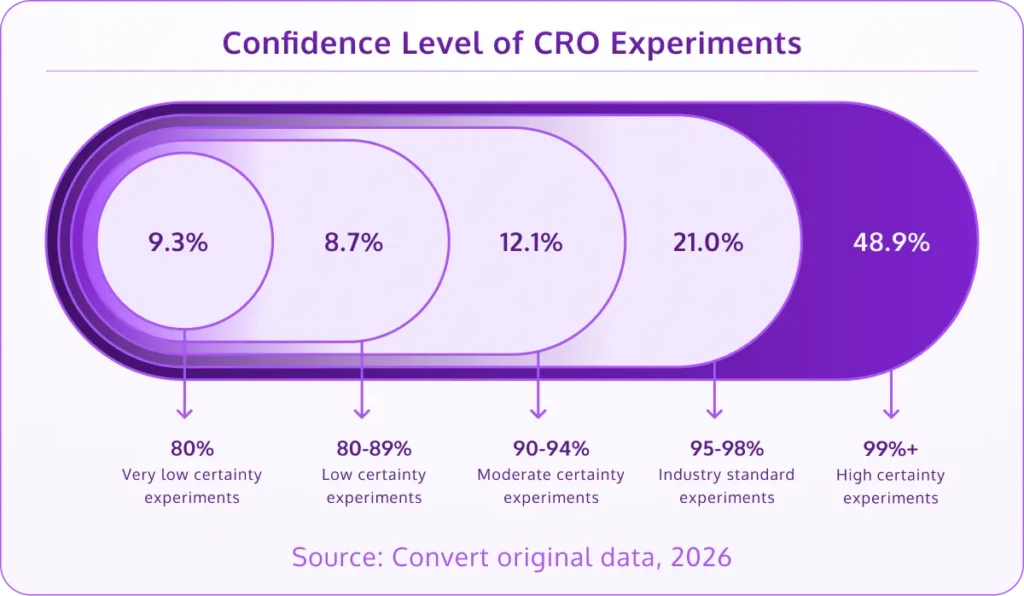
The industry has also shown a commitment to statistical integrity. Approximately 70% of CRO teams now run their experiments to a 95% statistical confidence level or higher, with 49% pushing for 99% confidence. This rigor is essential for avoiding "false positives" that can lead to costly implementation errors. However, under-powered tests remain a common pitfall. While the most common sample size per test ranges between 10,000 and 50,000 visitors (37% of tests), roughly 10% of experiments are still being run with fewer than 1,000 visitors, making the results statistically unreliable.
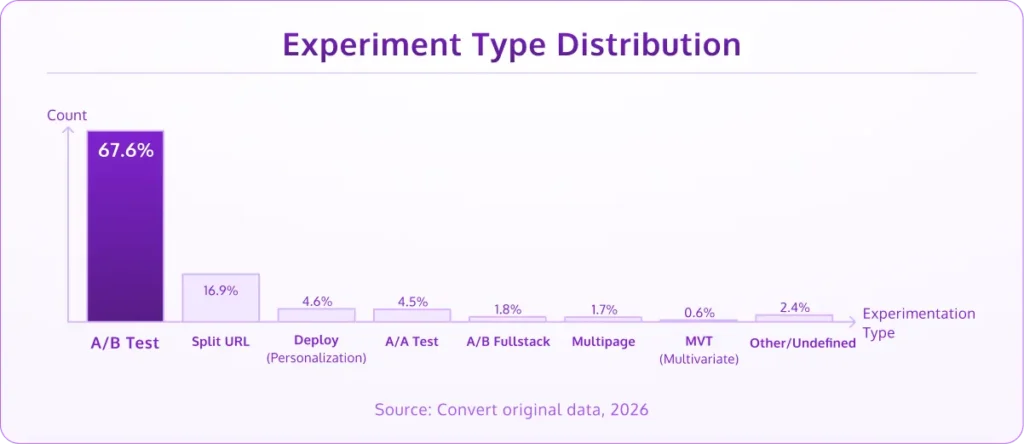
A critical component of mature programs is the use of A/A testing, which accounts for 4.5% of experiments. These tests, where two identical versions of a page are tested against each other, are used to calibrate tools and ensure that the underlying data tracking is accurate. Without this baseline, teams risk acting on skewed data.
The Reality of Performance Gains
Data from Convert’s original 2026 research clarifies the expectations of "lift" or improvement. While many marketing case studies highlight triple-digit gains, the reality of consistent experimentation is more modest. 60% of completed A/B tests deliver a lift of under 20%, and 84% come in under 50%. This reinforces the concept that CRO is a compounding game rather than a series of "silver bullets."
Interestingly, 7.8% of tests show an improvement of 100% or more. However, practitioners often cite Twyman’s Law in these instances: "Any statistic that appears interesting or looks different from the rest is usually wrong." While some of these are genuine breakthroughs—such as a revolutionary checkout flow or a major pricing pivot—many are the result of data anomalies or "novelty effects" that disappear once the change is fully implemented.
Organizational Challenges and the Recognition Gap
One of the most significant hurdles for modern experimentation teams is the lack of a prioritization framework. 58% of companies do not use a formal system like PIE (Potential, Importance, Ease) or ICE (Impact, Confidence, Ease) to rank their ideas. Even among high-level teams, only 57% have a well-defined framework. This leads to wasted resources on low-impact tests.
Furthermore, there is a notable "recognition gap." While 63% of companies claim their culture encourages testing, only 47% of practitioners feel their efforts are recognized by the organization. This 16-point discrepancy suggests that while testing is happening, it is often treated as "invisible work" that does not always influence high-level product or business strategy. This is compounded by the fact that 26% of companies lack a senior management sponsor to advocate for the program’s growth and budget.
The Agency Ecosystem and the AI Revolution
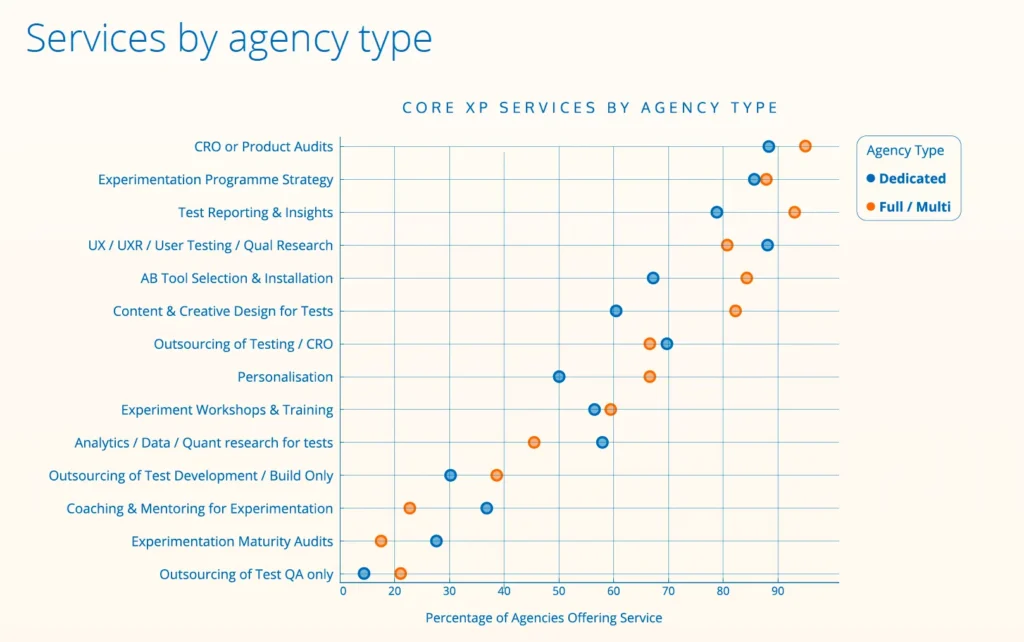
The agency landscape for experimentation is both global and specialized. Out of 237 identified agencies worldwide, 55% are dedicated solely to experimentation. Most are small, with over half employing five or fewer people, yet they are highly experienced; 90% have been in operation for over five years.

Artificial Intelligence has rapidly become the cornerstone of agency operations. 76% of agencies now report that AI is a key part of their workflow, used for research, hypothesis formation, and coding experiment variants. This adoption is even higher among newer, smaller agencies (81%). As AI automates the execution of tests, 70% of agencies are shifting their focus toward "strategic enablement"—helping clients design the internal processes and cultures necessary for long-term success rather than just delivering individual test wins.
There is also a clear shift toward product-led experimentation. 60% of agencies report that their primary stakeholders are moving from marketing departments to product teams. This change alters the scope of testing from simple "button color" changes to deep-funnel feature testing and architectural shifts.
User Experience Benchmarks and UX Strategy
The broader context of conversion optimization is informed by user experience (UX) standards. According to McKinsey, effective personalization can drive a revenue lift of 5% to 15% and improve marketing ROI by 10% to 30%. With 71% of consumers now expecting personalized interactions, the cost of non-compliance is rising.
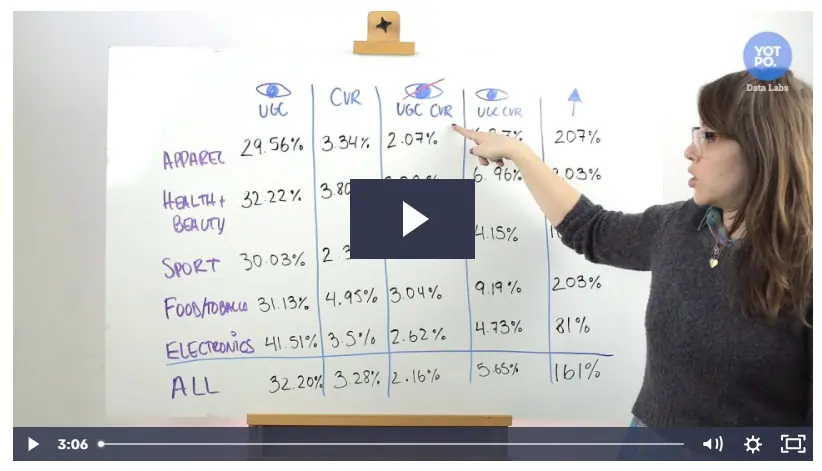
However, many organizations still struggle with basic friction points. Research from the Baymard Institute shows that the average e-commerce checkout still uses 11.3 form fields, despite most flows only requiring about eight. Reducing this cognitive load remains one of the highest-impact tactics in the CRO arsenal. Additionally, User-Generated Content (UGC) continues to be a potent tool, with studies from Yotpo suggesting it can increase conversion rates by as much as 161% in certain industries by providing social proof and reducing buyer hesitation.

Conclusion and Future Implications
The data for 2026 suggests that the experimentation industry is moving away from its "wild west" phase of ad-hoc testing toward a disciplined, scientifically-backed discipline. The most successful organizations are those that have moved beyond the "tools" phase and into the "culture" phase, where testing is the default method for making business decisions.
As AI continues to lower the technical barriers to executing tests, the competitive advantage will likely shift from those who can test to those who know what to test and how to integrate those findings into a broader business strategy. For the 99.8% of websites not yet experimenting, the window of opportunity to gain a first-mover advantage in their respective niches is closing as market leaders continue to compound their gains. The future of the digital economy belongs to those who view every user interaction not as a static event, but as a data point in a continuous cycle of learning and optimization.