The initial phase of AI-driven search has largely focused on a fundamental question for brands: "Are we showing up?" This has led to the widespread adoption of metrics like mentions and citations as key indicators of AI visibility. While valuable for establishing a baseline presence, these metrics are increasingly proving insufficient for understanding the true depth and durability of a brand’s engagement within AI-generated responses. As AI search matures, marketers are now grappling with a more complex challenge: not just if a brand appears, but how consistently, whether it’s being chosen, how it’s being perceived, and if the visibility is built to last.
This evolution marks a critical shift. The year 2025 was characterized by the imperative to prove presence in AI answers. The coming year, 2026, will be defined by the need to demonstrate that this presence has tangible value and enduring impact. To address this measurement gap, a new framework of Key Performance Indicators (KPIs) is emerging, designed to move beyond simple counts and delve into the qualitative aspects of AI visibility. These proposed KPIs, while not yet industry standards, offer a structured approach to asking more insightful questions of the data brands are already collecting, drawing inspiration from disciplines such as statistics, bibliometrics, brand tracking, and survey research.
The Measurement Challenge: From Presence to Performance
For a significant period, marketers could reasonably assess their AI search performance by answering a straightforward question: "Does our brand appear in AI-generated answers?" Mentions, which quantify the frequency of a brand’s appearance, and citations, which track links back to brand-associated sources, served as logical and accessible starting points. These metrics quickly became staples in AI visibility reporting, providing a clear signal of whether a brand was even in the conversation.
However, this initial focus on presence alone obscures crucial nuances. A brand might be mentioned numerous times but never be the AI’s primary recommendation. Its consistent appearance could be accompanied by descriptions that inadvertently undermine years of carefully crafted brand positioning. Furthermore, the visibility of a specific piece of content might fluctuate dramatically, appearing as a citation one week and vanishing the next. Even a seemingly strong visibility score holds little weight if the prompts being tracked bear little resemblance to the actual queries real customers are posing. This disconnect highlights the evolving measurement challenge: 2025 was about proving you show up; 2026 is about proving that visibility means something and that it holds.
To explore this next layer of AI search measurement, a comprehensive analysis was conducted over 13 weeks, tracking an anonymized B2B brand across four AI platforms and 33 distinct prompts. This research tested five proposed KPIs, aiming to provide a framework for understanding AI visibility beyond mere appearance. These KPIs are not intended as definitive benchmarks but as tools to prompt deeper inquiry, shifting the focus from "Are we present?" to a more strategic set of questions: "Where are we strong?", "Are we being chosen?", "How are we being understood?", "Does that visibility last?", and "Are we measuring the right demand in the first place?"
1. Consensus Position: Gauging the Breadth of AI Platform Adoption
While a standard mention score indicates how often a brand appears across all tracked prompts and platforms, it often fails to reveal the consistency of that presence. This is where the Consensus Position KPI comes into play. This metric conceptualizes each AI platform as an independent arbiter for a given prompt. It measures how many of these arbiters – for instance, four platforms in the analyzed test case – identify a brand for a specific query. This allows for a nuanced understanding of distribution, ranging from zero-platform presence to a four-platform consensus.
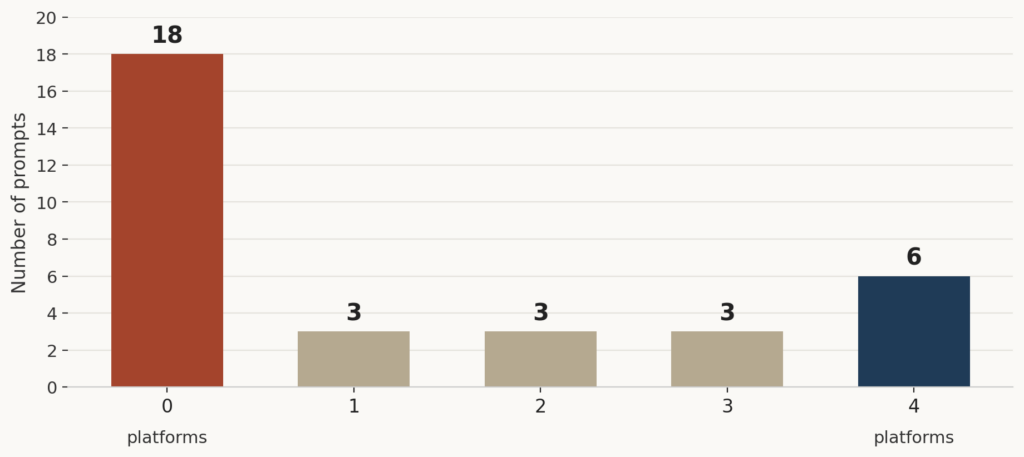
Instead of averaging these instances into a single, potentially misleading figure, Consensus Position illuminates the distribution of a brand’s appearances. In the analyzed account, 18 out of 33 prompts showed no brand presence across any of the tracked platforms. Conversely, six prompts saw the brand appear on all four platforms, while the remaining nine exhibited partial presence, appearing on one, two, or three platforms. A simple average of approximately 1.3 platforms per prompt might suggest unremarkable performance. However, the distribution reveals a far more actionable narrative.
This distribution necessitates distinct strategic approaches. Prompts with zero platform presence highlight areas where a brand is effectively invisible within the tracked AI ecosystem, signaling a need for new content creation or authority-building efforts. Prompts with four-platform consensus represent strong, established positions that warrant strategic defense. The prompts with partial presence, meanwhile, are often the most immediately actionable. Given that the brand already has some footing, closing the remaining visibility gap may be more achievable than building from scratch. The true value of Consensus Position, therefore, lies not in generating another visibility score, but in illuminating where visibility is absent, partial, or widely agreed upon, preventing these critical distinctions from being lost within an average.
2. Share of Recommendations: Differentiating Mentions from Endorsements
Once a brand’s presence in AI answers is established, the critical next question emerges: What is the AI model actually doing with that presence? There is a significant difference between an AI platform listing a brand as one among many options and explicitly recommending it as the definitive answer. Most mention metrics, however, treat these two outcomes identically.
Consider a scenario where a user asks an AI for the "best analytics software." The AI might present eight vendors, but then single out one as the strongest choice for the user’s specific needs. While all eight brands receive a mention, only one earns a recommendation. The Share of Recommendations KPI is designed to capture precisely this distinction.
In the tested account, there were 42 brand mentions across 33 tracked prompts. However, only four of these instances met the recommendation threshold, signifying the brand was presented as the direct answer, the primary choice, or an explicit suggestion, rather than simply appearing in a list. This resulted in a 12.1% Share of Recommendations and a 9.5% recommendation rate among mentions. The latter figure is particularly insightful as it quantifies how often presence translates into advocacy.
A brand that appears in 80% of answers but is recommended in only 5% faces a different challenge than one that appears in 20% of answers and is recommended 15% of the time. The former possesses visibility but struggles to persuade, while the latter may be compelling when it appears but requires broader coverage. Standard mention counts can create a deceptive similarity between these two scenarios. Consequently, Share of Recommendations serves as one of the closest AI search equivalents to a conversion signal, identifying the point where the AI model transitions from informing users about the market to actively advising them on specific choices.
This metric inherently involves judgment. Defining a "recommendation" requires a fixed and consistent standard, especially when AI models employ nuanced language such as "a strong option for teams that need X." The paramount importance lies in consistency: establishing the benchmark once and applying it uniformly over time is crucial to ensure that changes in the metric reflect shifts in model behavior, not merely in classification methods.
3. Citation Half-Life: Quantifying the Durability of AI Visibility
While earning a citation is inherently valuable, the longevity of that citation significantly impacts its true worth. A citation that appears one week and vanishes the next should not be equated with one that persists for months. The Citation Half-Life KPI introduces the dimension of time into the visibility equation.
This metric tracks the lifespan of every cited URL across repeated prompt executions. For each URL, its first and last appearance dates are recorded. The Citation Half-Life then calculates the typical duration for URLs that continue to be cited. In the analyzed test case, the median half-life for URLs cited more than once was 28 days. However, a more striking revelation emerged: a substantial 76% of cited URLs appeared for a single week and were never cited again.
This data fundamentally alters the perception of AI visibility’s value. Content formats that consistently generate long-lived citations can evolve into compounding assets. The initial effort to earn the citation is a one-time investment, while the resulting visibility continues to yield returns over time. Conversely, formats whose citations evaporate almost immediately create a dynamic where visibility must be perpetually re-earned. The same principle applies to third-party sources. If citations from one review site consistently endure while those from another aggregator disappear within a week, the former may hold considerably more value, even if both initially drive the same number of citations.
Citation Half-Life begins to address a question that most AI visibility dashboards currently struggle to answer: Where is our investment creating durable visibility, and where are we merely running on a treadmill? It is important to note that this metric should be interpreted with care. The 28-day median in this analysis applies only to the subset of URLs cited multiple times; across the entire dataset, the median would effectively be zero. Furthermore, a 13-week observation period is too short to establish an industry-wide benchmark. However, the core value at this stage lies in demonstrating that durability itself can be measured and compared over time.
4. Share of Narrative: Understanding AI’s Characterization of Brands
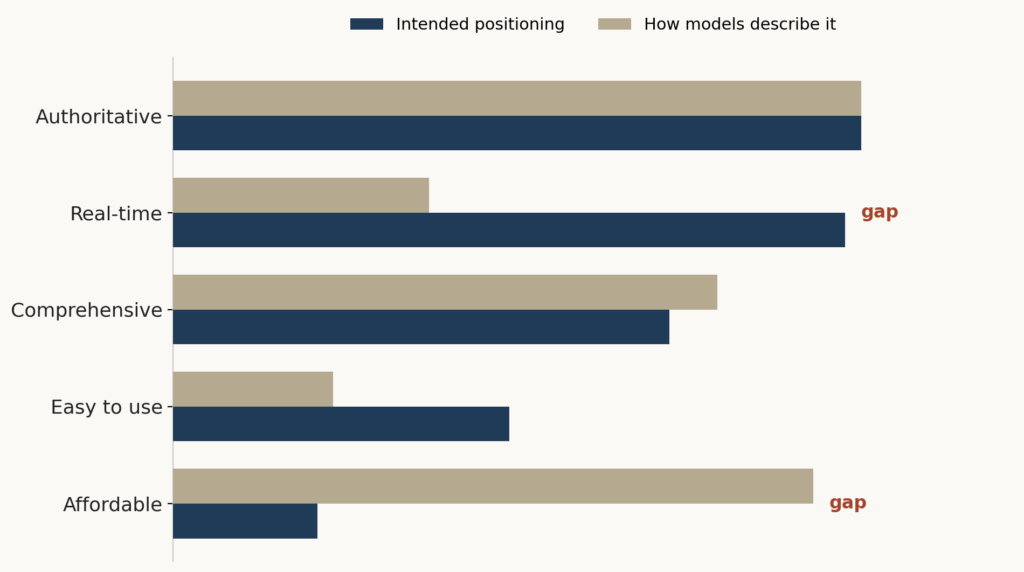
A brand can excel in mentions, recommendations, and citations yet still face significant challenges if it is being consistently characterized for the wrong reasons. The Share of Narrative KPI moves beyond mere appearance to assess how AI platforms describe a brand. This includes the attributes they associate with the brand, the use cases they assign to it, and the degree to which this language aligns with the brand’s desired positioning.
This metric is crucial because narrative problems often manifest subtly, rather than as outright negative sentiment. Imagine a software company that has invested heavily in positioning itself around real-time data capabilities. AI platforms may mention it frequently and in a positive light, but consistently describe it as "comprehensive, though slower to update." A conventional visibility dashboard might appear healthy, but from a brand perspective, the AI has learned precisely the wrong lesson.
Given the interpretive nature of this KPI, the methodology is paramount. A recommended approach involves three steps:
- Define Brand Attributes: Identify key attributes, use cases, and messaging pillars that the brand aims to own. These should be derived from existing positioning frameworks.
- Analyze AI-Generated Text: Extract descriptive language used by AI platforms in relation to the brand.
- Quantify Alignment: Measure the frequency and prominence of the predefined brand attributes within the AI-generated text.
The chosen attributes should originate from the brand itself, typically drawing from established positioning or messaging frameworks. The objective is consistency, not the pursuit of a single, objectively "correct" score.
The insights derived from Share of Narrative are significant. If a critical attribute repeatedly fails to appear, it suggests that the evidence supporting that position may not be reaching the sources AI platforms rely upon. Conversely, if the narrative shifts dramatically on one platform but remains stable elsewhere, it could indicate the influence of a specific source, page, or discussion that is uniquely shaping the model’s perception on that platform. Consequently, Share of Narrative should be viewed as a trend rather than an absolute benchmark. Modifying the attribute list or the classification methodology will naturally alter the results. The truly valuable signal lies in observing whether the gap between how the brand intends to be known and how AI describes it is widening or narrowing over time.
5. Prompt Space Coverage: Ensuring Measurement Aligns with Real-World Demand
All the preceding metrics hinge on a fundamental assumption: the prompts being tracked are representative of the demand the brand cares about. This assumption often warrants far more scrutiny than it typically receives. Traditional keyword research operated within a relatively observable search environment. In contrast, prompt behavior in AI search is far more fluid and difficult to define. Users can express the same core question in myriad ways, incorporating context, specific entities, combined needs, or engaging in conversational follow-ups.
This inherent variability means that the denominator behind any AI visibility score is, in essence, a curated list of prompts chosen by someone. The Prompt Space Coverage KPI challenges this by asking how well that chosen list overlaps with the actual questions being posed in the real world.
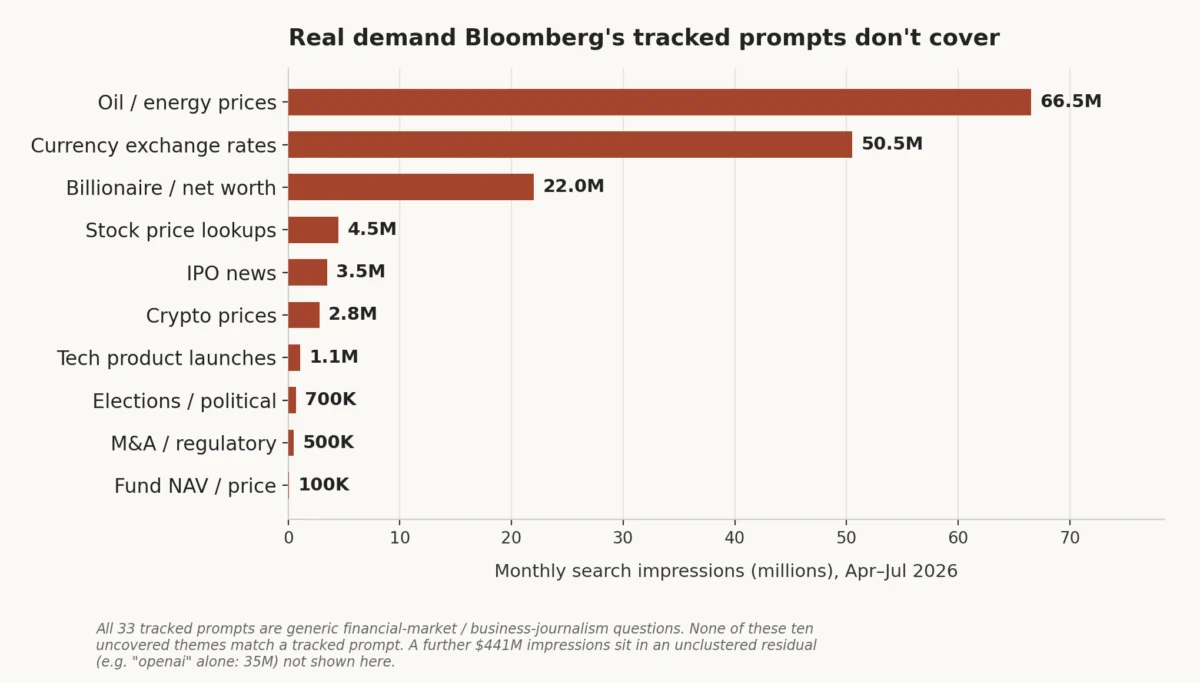
In the research account, the 33 tracked prompts were predominantly generic, evergreen queries related to financial markets and business journalism. A comparison of this set against Search Console data from April to July 2026 revealed approximately 690 million impressions across around 15,000 queries that fell into thematic areas not represented by any of the tracked prompts. These uncovered areas included significant demand around oil and energy prices (66.5 million impressions), currency exchange rates (50.5 million impressions), and billionaire and net-worth rankings (22 million impressions), alongside substantial interest in stock prices, IPO news, cryptocurrency, tech launches, elections, and mergers and acquisitions.
While the AI visibility program might not have been performing poorly against the specific prompts it was tracking, the critical issue was that these prompts captured only a fraction of the overall demand landscape. Prompt Space Coverage, therefore, serves as the honesty check on every other metric. A statement like "38% Share of Mentions" might sound precise, but if those prompts represent only 61% of the identified demand themes, then "38% Share of Mentions at 61% prompt coverage" offers a far more accurate and honest representation of performance.
This metric is unlikely to achieve perfect precision, as the reference set itself remains a sample. Its primary function is to expose significant blind spots rather than to claim the ability to count the entirety of the prompt universe. The uncovered areas are often more valuable than the percentage itself, as they provide teams with an immediate list of questions they are neither tracking nor, potentially, answering.
An Additional Insight: Source Concentration
Beyond the five core KPIs, the research identified an additional signal worth monitoring, though not classified as a primary growth metric: Source Concentration. This metric examines the degree to which a brand’s AI visibility relies on a limited number of cited domains. If the majority of citations originate from just two websites, that visibility may be inherently more fragile than a similar level of visibility supported by dozens of independent sources.
This concept draws inspiration from the Herfindahl-Hirschman Index (HHI), commonly used to measure market concentration. When applied to AI search, Source Concentration can reveal whether citation visibility is broadly distributed or disproportionately concentrated on a few key domains. In the analyzed account, the median score was 407 (on a 0-10,000 scale), suggesting a relatively diverse sourcing landscape.
It is important to note that this is not necessarily a metric that a brand can or should actively optimize to a specific number. Certain categories naturally have a smaller pool of authoritative sources than others. The value of Source Concentration lies in understanding the dependencies of a brand’s visibility. This awareness can highlight where changes to a single page, the locking of a thread, or the blocking of a crawler could create disproportionate risk.
The Future of AI Visibility: A Multifaceted Approach
With the introduction of these new metrics, the temptation to consolidate them into a single, overarching "AI Visibility Score" is understandable. However, such an approach risks missing the fundamental point. Each KPI is designed to address a distinct strategic question. Consensus Position reveals where visibility is established or fragmented. Share of Recommendations indicates whether that visibility translates into genuine advocacy. Citation Half-Life measures the persistence of that visibility. Share of Narrative clarifies what a brand is becoming known for. And Prompt Space Coverage ensures the entire measurement framework is aligned with relevant demand.
Compressing these nuanced questions into a single number might simplify a dashboard, but it can obscure the underlying complexities of the problem. Consensus Position serves as a prime example: an average of 1.3 platforms per prompt might seem like a singular, middling result. In reality, it encapsulates three vastly different scenarios: 18 prompts with no presence, six with complete presence, and nine with partial presence that may represent the most immediate opportunities for growth. The average metric erases the very distinctions that render the data actionable.
Furthermore, the field of AI search measurement is still in its nascent stages. None of these proposed KPIs have yet been definitively validated against long-term revenue performance. Some, particularly Share of Narrative, remain inherently interpretive. The objective is not to overstate the maturity of AI search measurement but to build upon methodologies with established precedents in other fields and to test their efficacy in providing marketers with more insightful signals than simple mention and citation counts.
Ultimately, the trajectory of AI visibility measurement must move beyond superficial metrics. Knowing that a brand appears in an AI answer is a starting point. Understanding how consistently it appears, whether it is recommended, what the AI model communicates about it, how long that visibility endures, and whether the measurement framework is accurately capturing relevant demand provides a far more robust foundation for strategic decision-making. Mentions and citations proved presence. The next critical task is to prove that this presence is meaningful and sustainable.