The landscape of business intelligence underwent a significant transformation throughout 2017, marked by a shift from static, cumbersome reporting to dynamic, interactive data storytelling. At the center of this evolution was Google Data Studio, a tool that transitioned from its beta phase into a powerhouse for both corporate analysts and data journalists. By democratizing access to sophisticated visualization techniques, the platform allowed users to bridge the gap between raw data collection and actionable insights. The following analysis examines several high-profile use cases that defined the standard for data visualization during this pivotal era, highlighting the intersection of aesthetic design, technical integration, and narrative clarity.
The Evolution of Data Accessibility and the Business Intelligence Market
Prior to the widespread adoption of cloud-based visualization tools, organizations often struggled with the “last mile” of data analysis. While tools like Google Analytics and BigQuery were efficient at capturing and storing information, presenting that information to stakeholders required significant manual labor, often involving exported spreadsheets and static slide decks. The introduction of Google Data Studio addressed these inefficiencies by providing a native, web-based environment where data could flow seamlessly from the source to the dashboard.
By 2018, the business intelligence market was characterized by a push toward “data democratization.” Companies no longer wanted data siloed within IT departments; they required marketing managers, SEO specialists, and executives to have real-time access to performance metrics. This shift necessitated a tool that was powerful enough for complex data blending but intuitive enough for non-technical users to navigate. The examples highlighted below represent the vanguard of this movement, showcasing how diverse industries utilized the platform to solve specific operational challenges.
Streamlining Operations: From Five Days to Fifteen Minutes
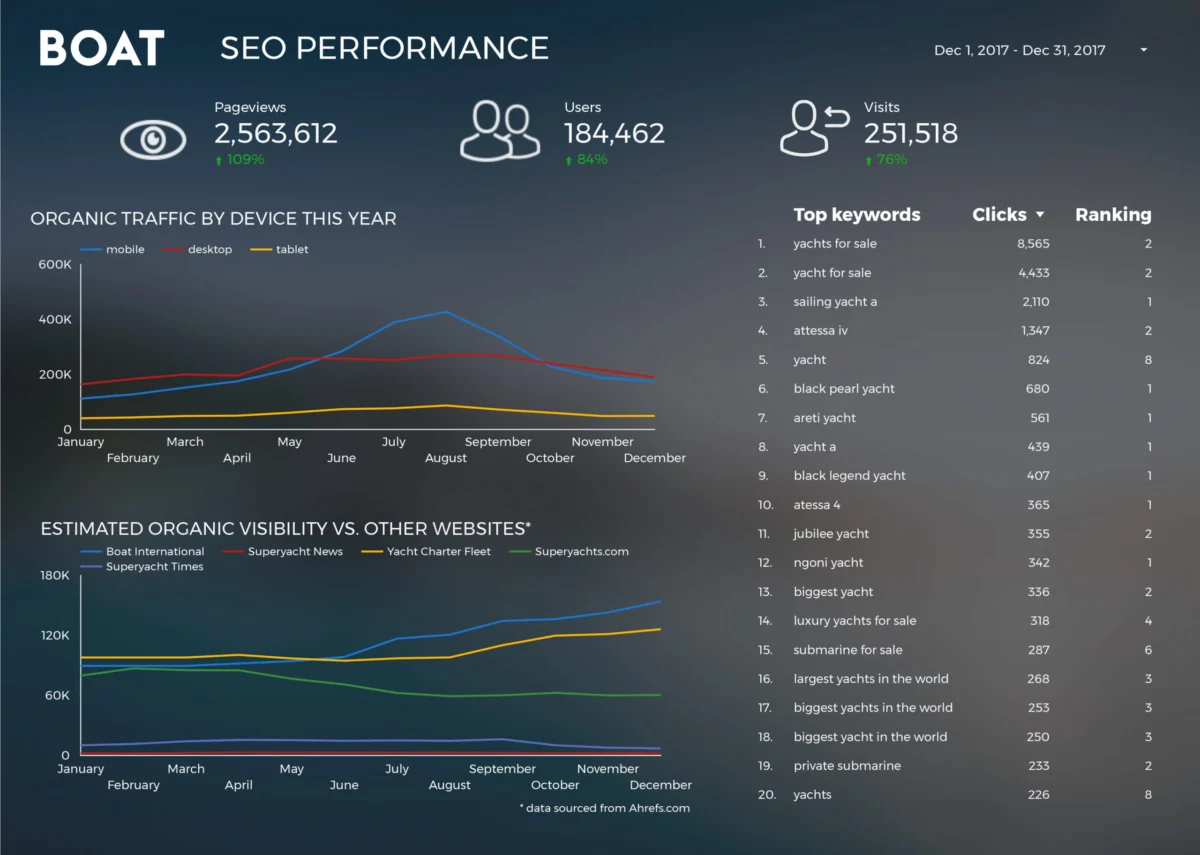
One of the most compelling business cases for the adoption of Google Data Studio is found in the operational overhaul at Boat International Media. Before implementing a centralized dashboard system, the organization’s SEO performance reporting was a grueling manual process. Analysts, including Fanni Takacs and Drew Broomhall, spent approximately five business days every month aggregating data, formatting charts, and drafting insights for client reports.
By leveraging Data Studio’s ability to connect directly to Search Console and Google Analytics, the team successfully automated the data retrieval and visualization process. The result was a reduction in reporting time from forty hours to a mere fifteen minutes. This 99% increase in efficiency did more than just save time; it allowed the agency to pivot from “data gathering” to “data strategy.”

The Boat International report was notable for its adherence to design principles that favored clarity over clutter. By utilizing a clean layout and a focused color palette, the report functioned as both an interactive online tool and a high-quality PDF export. This dual-purpose design addressed a common friction point in agency-client relations: the need for a “source of truth” that remains legible across different media formats.
Technical Precision in Web Analytics and Performance Benchmarking
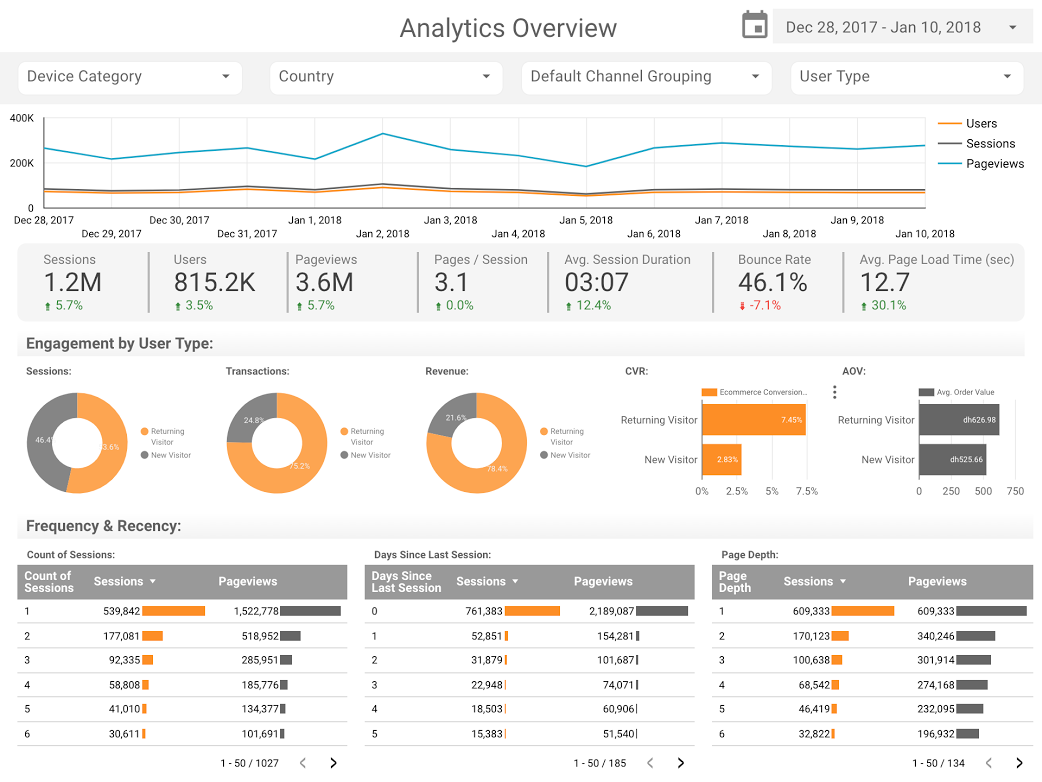
As organizations grew more sophisticated in their use of Google Analytics, the need for customized overviews became paramount. The ClickInsight team and E-Nor, represented by Senior Consultant Sunil Attri, developed templates that moved beyond the standard “out-of-the-box” reports provided by Google. These dashboards utilized Data Studio’s interactive filters—such as date range selectors and dimension filters—to allow users to drill down into specific segments of web traffic without needing to navigate the complex Google Analytics interface.
A significant technical advancement during this period was the creative application of bullet charts for page-level engagement. Analytics Pros demonstrated how these charts could be used to provide immediate context for performance. Unlike a standard bar chart, a bullet chart allows an analyst to see a primary measure (such as current page views) in the context of a target (a KPI goal) and a background comparative range (last year’s performance).
This method of visualization addresses the “so what?” factor in data analysis. By seeing a metric positioned against a benchmark, stakeholders can instantly discern whether a page is over-performing or under-performing. The addition of scorecard metrics—tracking time on page and engagement rates—further enriched the narrative, moving the focus from mere volume to the quality of the user experience.
Data Journalism: Bridging the Gap Between Information and Entertainment
Beyond the boardroom, Google Data Studio emerged as a potent tool for data journalism. The ability to embed interactive reports into blog posts and news articles allowed creators to tell complex stories about pop culture, technology, and sociology.
The Cinematic Battle: Marvel vs. DC
The global fascination with superhero cinema provided a rich dataset for comparative analysis. With the worldwide box office for these franchises exceeding $27 billion, the financial stakes were immense. Visualizations comparing the Marvel Cinematic Universe (MCU) and the DC Extended Universe (DCEU) utilized Data Studio to track box office returns, critical reception (Rotten Tomatoes scores), and audience sentiment over time.

These reports highlighted a clear trend: while both franchises commanded massive audiences, the MCU maintained a more consistent trajectory of critical and commercial growth. The use of interactive tabs allowed readers to explore the performance of individual films, providing a granular look at how specific characters—such as Iron Man or Wonder Woman—impacted the overall health of their respective studios.
The Technical Infrastructure of Open Source
In the realm of technology, Google Developer Advocate Felipe Hoffa utilized the platform to analyze the state of open-source development. By pulling PushEvents from GitHub’s 2017 archives and processing them through BigQuery, Hoffa created a visualization that identified the most prolific contributors to the web’s infrastructure.
This use case demonstrated the power of the BigQuery connector. Because BigQuery can process petabytes of data in seconds, Data Studio can serve as the visual frontend for massive datasets that would crash traditional spreadsheet software. The resulting report showed that companies like Google, Microsoft, and Red Hat were among the top contributors, providing a factual basis for discussions regarding the corporate influence on open-source ecosystems.
Sociological Insights: 150 Years of UK Marriages and Divorces
Perhaps the most ambitious use of the platform involved the analysis of long-term sociological trends. A report by Lizzie Silvey and her colleagues examined 150 years of marriage and divorce data in the United Kingdom. This project required the normalization of historical records to create a cohesive timeline that spanned the mid-19th century to the present day.
The visualization answered critical questions about the impact of external shocks on social structures. For instance, the data clearly showed sharp declines in marriage rates during World War I and World War II, followed by significant “spikes” in the post-war years. Furthermore, the report tracked the impact of legislative changes, such as the Divorce Reform Act of 1969, which led to a measurable surge in divorce rates in the early 1970s.
By presenting this data through an interactive lens, the creators allowed users to see the human story behind the statistics. It moved the data beyond a simple history lesson, turning it into a study of how law, war, and economic shifts reshape the most fundamental units of society.
The Broader Impact on the Professional Landscape
The proliferation of these visualizations in 2017 and 2018 signaled a permanent change in how information is consumed. The implications of this shift are three-fold:
- Increased Accountability: When data is presented clearly and updated in real-time, there is “nowhere to hide.” Marketing teams and executives are held to a higher standard of transparency when performance metrics are accessible to the entire organization.
- Efficiency Gains: As seen with Boat International, the automation of reporting represents a massive recovery of billable hours. This allows firms to reduce overhead and focus on high-level analysis rather than administrative tasks.
- Enhanced Data Literacy: By interacting with dashboards, non-technical employees become more comfortable with data. They learn to ask better questions, understand the significance of statistical significance, and make decisions based on evidence rather than intuition.
Chronology of Development and Future Outlook
The journey of Google Data Studio began as part of the Google Analytics 360 Suite in mid-2016. Throughout 2017, Google aggressively expanded its feature set, adding community connectors that allowed the tool to pull data from Facebook Ads, Adobe Analytics, and Twitter. By the time these featured visualizations were published in early 2018, the tool had become a central pillar of the Google Cloud ecosystem.
In the years following this period, Google continued to integrate the product deeper into its enterprise offerings, eventually rebranding it as Looker Studio following the acquisition of Looker. This transition further solidified the tool’s place in the market, adding even more robust data modeling capabilities.
The examples from 2017 serve as a reminder that the core of good data visualization is not the complexity of the software, but the clarity of the narrative. Whether tracking the success of a blockbuster movie or the SEO performance of a luxury yacht brand, the goal remains the same: to turn a sea of numbers into a clear, actionable story. As we move further into an era dominated by Big Data and Artificial Intelligence, the principles of design and storytelling established by these early adopters continue to guide the next generation of analysts.