


The practice of forecasting the long-term financial impact of conversion rate optimization (CRO) experiments remains one of the most debated topics within the digital marketing and data science communities. At the heart of this controversy is the inherent uncertainty of translating a localized experimental "lift"—such as a 10% increase in conversion rate during a two-week trial—into a sustained, 10% increase in total monthly or annual revenue. While stakeholders and C-suite executives increasingly demand tangible financial projections to justify CRO budgets, practitioners often struggle with the volatility of external market factors that can decouple experimental results from real-world accounting.

The Challenge of Proving Causality in Revenue Gains
The primary reason revenue forecasting is viewed with skepticism in the CRO world is the difficulty of maintaining a controlled environment over long durations. A fundamental principle of A/B testing is its ability to prove causality through randomization, a method often referred to as the "gold standard" in both medical research and behavioral economics. However, once an experiment concludes and the winning variant is implemented permanently, the "control" group effectively disappears. Without a concurrent control group, it becomes impossible to determine if subsequent revenue fluctuations are the result of the website change or external shifts in the business environment.
Several confounding variables frequently disrupt the accuracy of revenue projections. For instance, a reduction in advertising spend, the emergence of a new competitor outranking the site for key search terms, or a shift in broader economic conditions can all suppress revenue even if a CRO implementation is performing as expected. Conversely, a holiday season or a viral social media mention might artificially inflate revenue, leading to an overestimation of the experiment’s true impact. This is the core reason why randomized A/B testing is superior to pre- and post-comparison models; the latter fails to account for "noise" in the data, whereas the former isolates the specific impact of a singular change.

Establishing Statistical Robustness as a Foundation
To build a credible revenue forecast, an organization must first ensure that the individual experiments feeding into the model are statistically sound. A forecast is only as reliable as the data points it aggregates. This requires a commitment to rigorous statistical parameters, specifically regarding power and significance.
Powering an experiment correctly ensures that the sample size is large enough to detect a meaningful difference between the control and the variant. In the absence of adequate power, a business risks making decisions based on "false negatives" or "false positives," both of which render any subsequent revenue forecasting moot. Furthermore, establishing a clear Minimum Detectable Effect (MDE) helps practitioners understand the threshold at which a change becomes financially significant for the business. By adhering to these standards, CRO teams can provide executives with the assurance that their projections are built on a foundation of scientific causality rather than anecdotal evidence.
The Necessity of Conservative Forecasting Models
One of the most common pitfalls in CRO reporting is the "linear extrapolation error," where a practitioner takes a percentage lift from a test and multiplies it by the company’s total annual revenue. For example, if an e-commerce store generating $20 million annually sees a 10% lift in a checkout page test, a naive forecast might suggest a $2 million increase in yearly revenue. However, such calculations are rarely accurate in practice.
Professional forecasting requires a more nuanced, conservative approach for three critical reasons:
- Limited Exposure: Not every user who visits a website will interact with the specific element that was tested. If a test was conducted on a specific category page that only receives 20% of total site traffic, applying the lift to the entire company’s revenue is a fundamental error.
- Implementation Delays: There is often a significant gap between the conclusion of a test and the actual deployment of the change by the engineering team. Revenue cannot be claimed for the period when the winning variant was not yet live.
- The Decay Factor: Consumer behavior is not static. A design change that is effective today may lose its impact over six to twelve months as design trends evolve or as the novelty wears off.
Beyond technical accuracy, there are political and organizational reasons to remain conservative. Over-promising and under-delivering can erode the credibility of a CRO program. When a forecast is too aggressive and the end-of-year financial statements do not reflect the projected millions, the experimentation team often faces intense scrutiny. By contrast, a conservative model that accounts for "haircuts" (discounts on the lift) and "decay" (reduction of impact over time) builds long-term trust with financial stakeholders.
Practical Application: The "Haircut" and "Decay" Methodology
A robust revenue projection model typically involves several layers of adjustment to ensure realism. In practice, a conservative estimate for a 10% experimental lift might look like the following:
- The 10% Haircut: Immediately discounting the observed lift by 10% to account for the "winner’s curse" and statistical regression to the mean.
- Segmented Traffic Impact: If the test only affected 50% of the total site traffic, the projected lift is halved.
- The Hold Period: Projecting the full (adjusted) impact for a limited window, such as four months, before assuming the effect begins to diminish.
- Monthly Decay: Applying a monthly reduction—often around 20%—to the projected gains after the initial hold period to account for changing market dynamics.
Under this model, a raw 10% lift does not result in a permanent 10% revenue increase. Instead, it results in a calculated, diminishing contribution that eventually phases out, reflecting the reality of the digital marketplace.
The Role of Analytical Tools and Cumulative Reporting
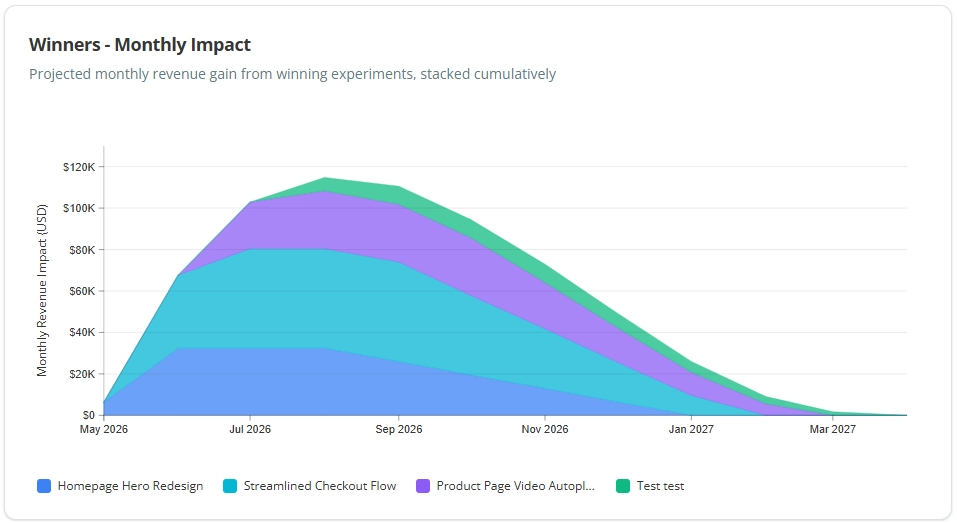
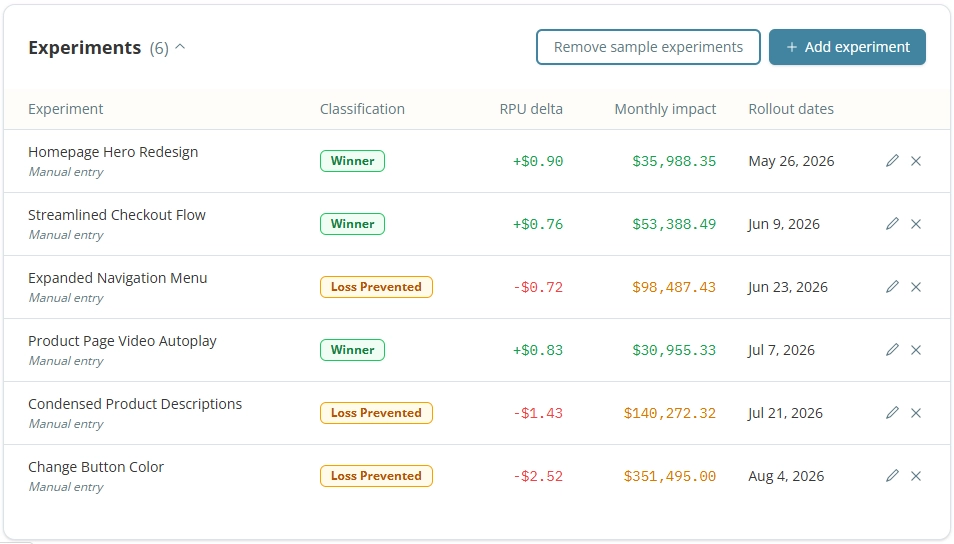
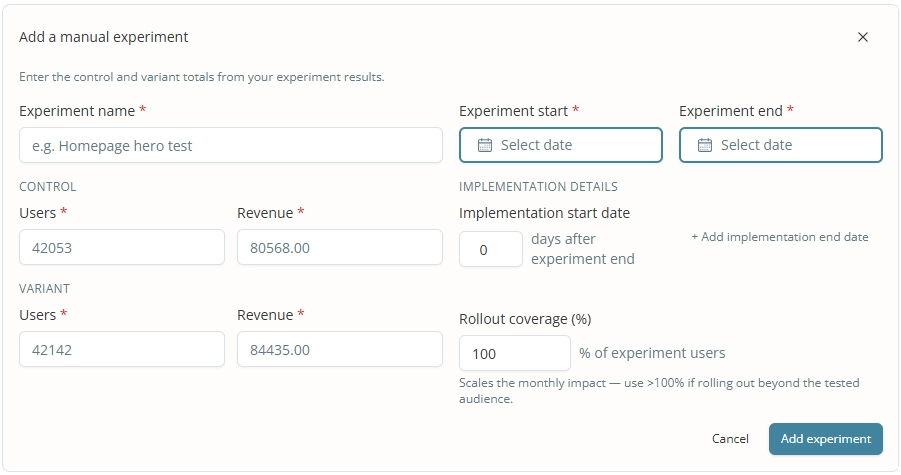
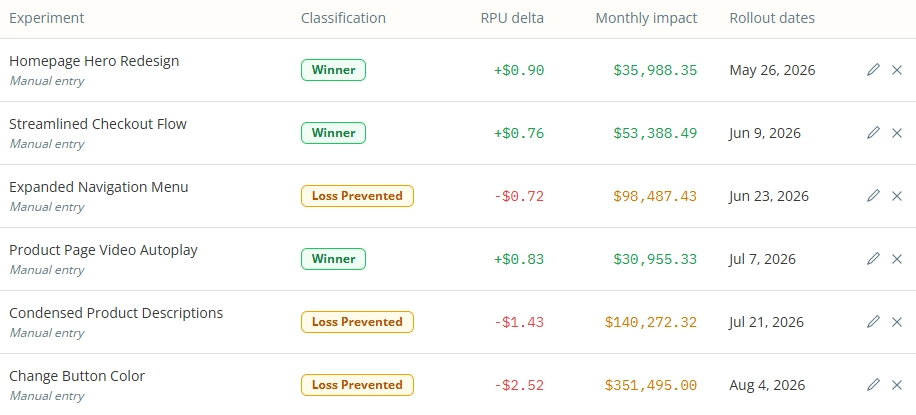
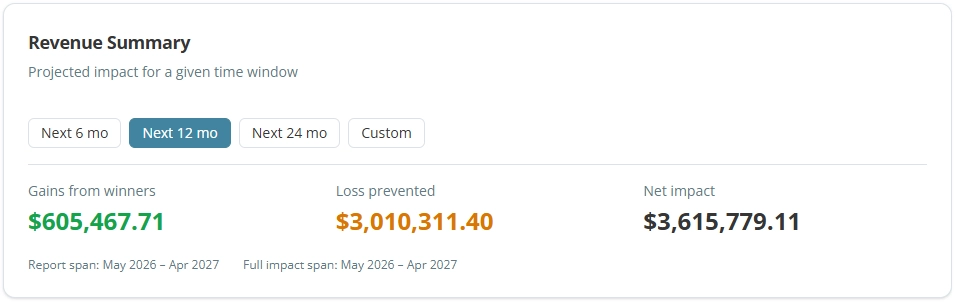
As CRO programs mature, managing these calculations manually becomes increasingly complex, especially when multiple winning experiments are implemented throughout the year. Modern experimentation analytics tools, such as Katsed, have begun to automate this process. These tools allow teams to input specific data points—such as users and revenue for both control and variant, implementation dates, and rollout coverage—to generate cumulative revenue charts.

The cumulative impact is particularly important for executive reporting. It shows how various wins "stack" on top of each other over time. For instance, a win in January might contribute $5,000 per month, while a win in March adds another $3,000. A cumulative chart visualizes the total added value of the CRO program at any given point in the future, providing a clear picture of the program’s contribution to the bottom line.
Connecting Revenue Projections to Return on Investment (ROI)
While revenue forecasting focuses on the "gain" side of the ledger, a complete business analysis must also consider the "cost" side to determine the Return on Investment (ROI). For an internal program, this includes the salaries of the CRO team, the cost of A/B testing software, and the engineering hours required to implement changes. For agencies, it involves the fees charged to the client versus the projected revenue generated.
By subtracting the program costs from the projected revenue gains, organizations can move beyond "conversion rates" and start talking about "profitability." This shift in language is essential for elevating CRO from a tactical marketing function to a core business strategy. When a team can demonstrate that for every $1 spent on experimentation, the company realizes $5 in projected revenue (even after conservative adjustments), the argument for scaling the program becomes undeniable.
Conclusion: Embracing the Model Over Absolute Certainty
Ultimately, practitioners must accept that revenue forecasting is a model, not a mirror of reality. In the world of business intelligence, no tool or methodology provides 100% accuracy; even standard web analytics platforms frequently disagree with backend financial databases. The goal of a revenue forecast is not to predict the future with perfect precision, but to provide a logical, data-backed estimate that aids in decision-making and resource allocation.
By making assumptions explicit—such as the use of "haircuts" and "decay rates"—and focusing on the quality of the experiments that enter the model, CRO professionals can provide immense value to their organizations. Forecasting transforms the perception of experimentation from a series of isolated tests into a predictable engine for business growth. As the industry continues to move toward more sophisticated data models, the ability to translate statistical significance into financial impact will remain the hallmark of a high-performing optimization program.







