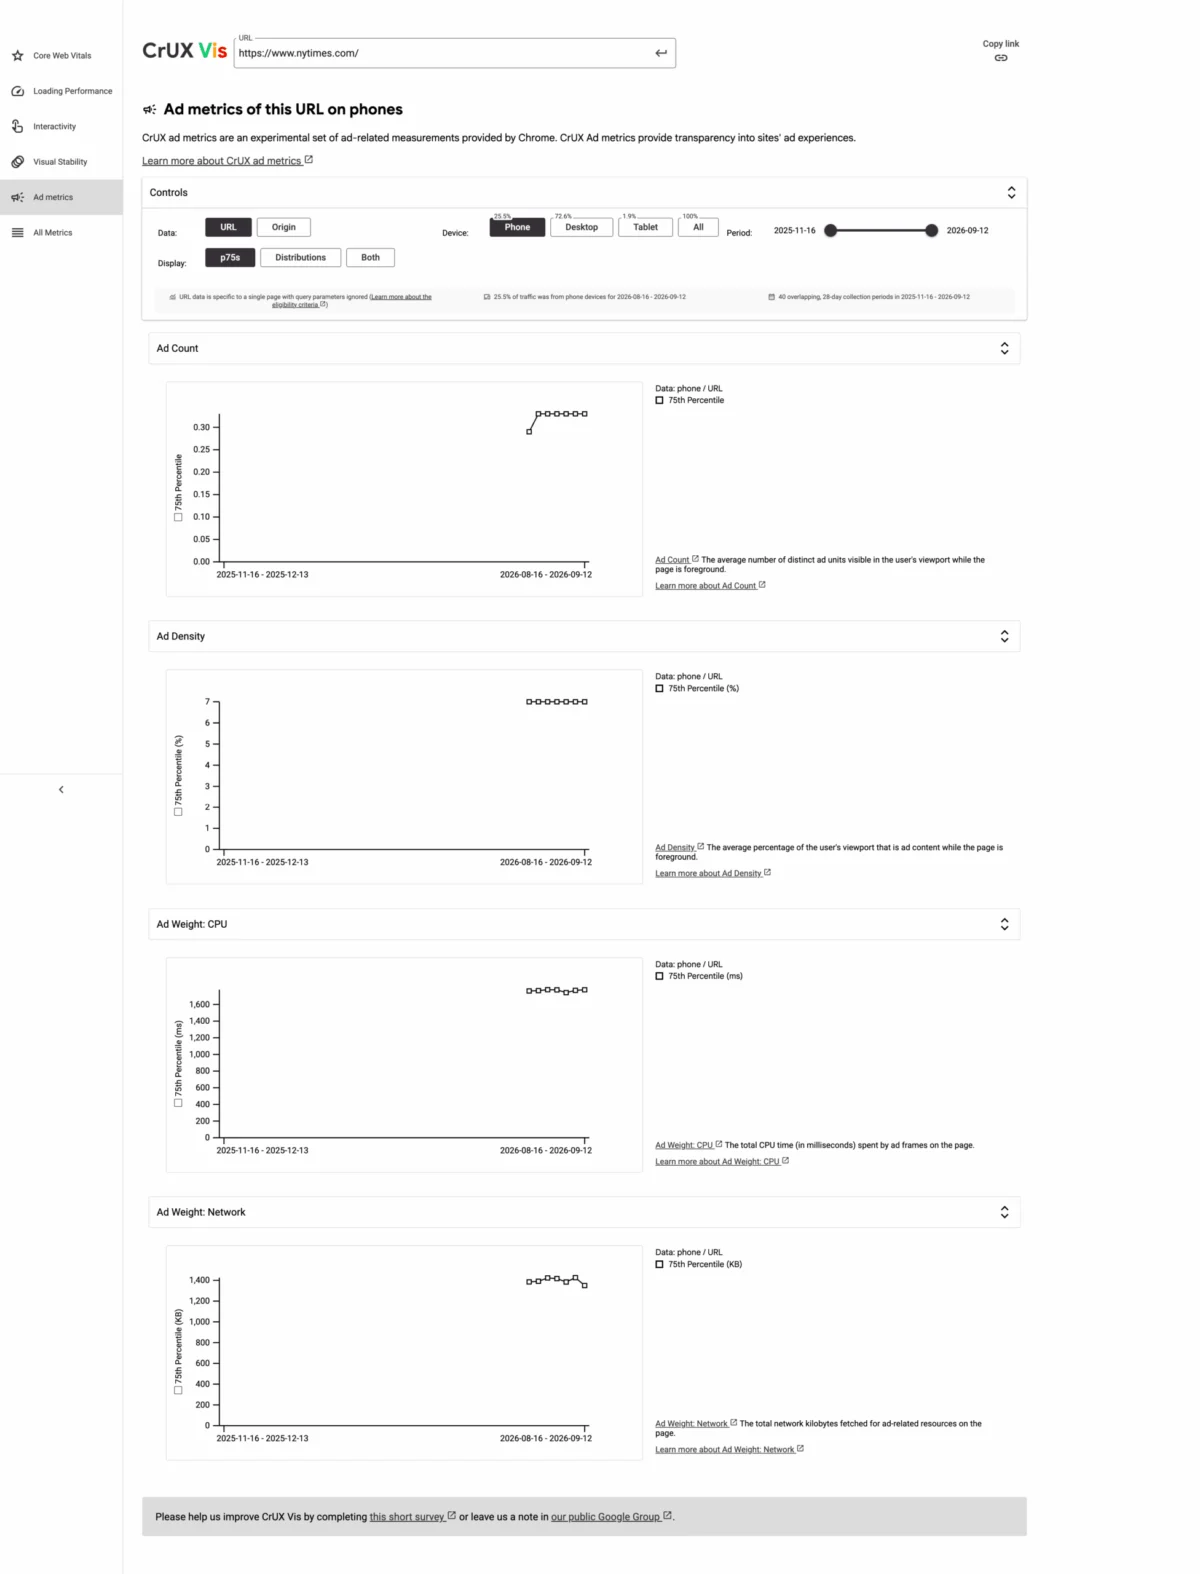
Google has announced the integration of new, experimental ad metrics within its widely utilized Chrome User Experience Report (CrUX), marking a significant step towards providing greater transparency and detailed insights into the impact of advertisements on web performance and user experience. These innovative metrics—Ad Count, Ad Density, Ad Weight (Network), and Ad Weight (CPU)—are designed to empower web developers, publishers, and advertisers with crucial data to assess and optimize the ad experiences delivered through the Chrome browser. The initiative, revealed on September 15, 2026, underscores Google’s ongoing commitment to fostering a healthier, faster, and more user-friendly web ecosystem.
The introduction of these metrics comes at a time when the balance between ad monetization and user experience has become increasingly critical. Web advertisements, while essential for supporting much of the free content available online, can often contribute to slower page loads, excessive data consumption, and a diminished browsing experience. Google, as both a major advertising platform provider and the developer of the world’s most popular web browser, Chrome, has consistently championed initiatives aimed at improving web performance and user satisfaction. The CrUX ad metrics represent a targeted effort to quantify the performance overhead associated with advertising, providing actionable data for improvement.
Understanding the New Ad Metrics: A Deeper Dive into Performance Impact
The four new experimental metrics offer a multi-faceted view of how advertisements influence a website’s performance profile. Each metric addresses a distinct aspect of ad impact, from sheer volume to resource consumption.
- Ad Count: This metric quantifies the total number of distinct advertisements detected on a given webpage. It provides a straightforward measure of ad load, indicating the potential for visual clutter and the cumulative performance impact of multiple ad requests. A high ad count often correlates with increased network requests and CPU activity, directly affecting page load times and responsiveness.
- Ad Density: Ad Density measures the proportion of the visible screen area occupied by advertisements. This metric is crucial for understanding the visual intrusiveness of ads and their potential to disrupt content consumption. High ad density can lead to a frustrating user experience, requiring users to scroll excessively or navigate around large ad blocks to access the main content. This metric is particularly relevant in the context of Google’s previous efforts to penalize intrusive interstitial ads and promote better ad layouts.
- Ad Weight (Network): This metric quantifies the total network bytes downloaded specifically for advertisements on a page. Network weight is a direct indicator of data consumption attributable to ads. Heavy ad network payloads can significantly increase page load times, especially for users on slower connections or with limited data plans. This metric highlights the importance of efficient ad creative delivery, optimized image sizes, and streamlined ad serving technologies.
- Ad Weight (CPU): Ad Weight (CPU) measures the total CPU time spent executing scripts and rendering elements associated with advertisements. This metric is vital for understanding the computational overhead introduced by ads. Ad scripts, often complex and resource-intensive, can block the main thread, leading to jank, input latency, and a generally unresponsive user interface. High CPU usage from ads can severely impact metrics like First Input Delay (FID) and Interaction to Next Paint (INP), which are critical components of a smooth user experience.
According to Barry Pollard from Google, speaking on Bluesky, these metrics are "a set of ad-related measurements that provide transparency into sites’ ad experiences." He emphasized their "experimental" nature, indicating that Google is still gathering feedback and refining the methodology. Alex Cone, also from Google, underscored their utility, stating that Google "expects these metrics to be particularly useful for web advertisers and the services they use to place ads." This suggests a dual benefit: not only will publishers gain insights into their ad implementations, but advertisers will also be able to better understand the context and performance implications of their campaigns on various sites.
The Broader Context: CrUX, Core Web Vitals, and Web Performance
The Chrome User Experience Report (CrUX) is a public dataset of real user experience data collected from Chrome users. It measures how real users experience the web and provides aggregated data for millions of websites. CrUX data is foundational to Google’s Core Web Vitals (CWV) initiative, which defines a set of key performance metrics considered essential for a good user experience. These include:
- Largest Contentful Paint (LCP): Measures perceived load speed, marking the point when the page’s main content has likely loaded.
- First Input Delay (FID): Measures responsiveness, quantifying the time from when a user first interacts with a page to the time when the browser is actually able to respond to that interaction. (Note: FID is being replaced by Interaction to Next Paint (INP) as a Core Web Vital in March 2024, but the principle of responsiveness remains central).
- Cumulative Layout Shift (CLS): Measures visual stability, quantifying the amount of unexpected layout shift of visual page content.
Ads are a notoriously significant contributor to poor Core Web Vitals scores. Large ad creatives can delay LCP, complex ad scripts can increase FID/INP by blocking the main thread, and dynamically loading ads often cause significant CLS, frustrating users by unexpectedly moving content. By providing specific ad-related metrics within CrUX, Google is directly addressing a major root cause of poor CWV scores, enabling more targeted optimization efforts.
CrUX data is gathered from anonymized user data of Chrome users who have opted into usage statistics syncing, offering a robust, real-world perspective on site performance. It differs from lab data (e.g., Lighthouse) by reflecting actual user conditions, including varying network speeds, device types, and geographical locations. This real-world perspective makes the new ad metrics particularly valuable, as they reflect the true impact of ads on a diverse user base.
Why Ad Performance Matters: User Experience, SEO, and Monetization
The interplay between ad performance, user experience, and search engine optimization (SEO) has grown increasingly complex. Google has explicitly stated that Core Web Vitals are a ranking factor, meaning that websites offering a superior user experience, as measured by CWV, are more likely to perform better in search results. Since ads frequently impede CWV scores, optimizing ad performance becomes an indirect, yet powerful, SEO strategy.
From a user experience standpoint, slow-loading, intrusive, or heavy ads can lead to:
- Increased bounce rates: Users abandon slow or cluttered pages quickly.
- Reduced engagement: Users are less likely to interact with content if ads are disruptive.
- Brand perception damage: A poor ad experience can reflect negatively on the publisher’s brand.
- Ad blocker adoption: Frustrated users are more likely to install ad blockers, reducing ad revenue opportunities.
For publishers, this creates a delicate balancing act. While ads are vital for monetization, an overly aggressive ad strategy can alienate users, harm SEO, and ultimately diminish long-term revenue potential. The new CrUX ad metrics provide the necessary tools to navigate this balance more effectively. Publishers can now quantitatively assess the trade-offs between ad revenue and user experience metrics, making data-driven decisions about ad placement, quantity, and technology.
Google’s Stance on Ad Quality and User Experience: A History of Intervention
The introduction of CrUX ad metrics is not an isolated event but rather a continuation of Google’s multi-year effort to improve the quality of the web and the experience of its users. This timeline highlights Google’s consistent focus on addressing problematic ad experiences:
- 2017: Google announced its support for the Coalition for Better Ads and the introduction of its own Ad Experience Report. This report identifies sites with intrusive or disruptive ad experiences (e.g., pop-up ads, auto-playing video ads with sound) and warns publishers.
- 2018: Chrome began blocking ads on websites that consistently display "bad ads" as defined by the Coalition for Better Ads standards. This was a significant step, directly intervening to improve user experience.
- 2020: Chrome introduced specific interventions against "heavy ads" – ads that consume excessive network data or CPU resources without explicit user interaction. These ads could be automatically unloaded by the browser.
- Ongoing: Google has continuously refined its ad policies for its own platforms (AdSense, Ad Manager) to encourage publishers to prioritize user experience, for instance, by promoting responsive ad units and discouraging certain intrusive formats.
The CrUX ad metrics extend this lineage by moving beyond binary blocking or policy enforcement to provide granular, measurable data. Instead of just identifying "bad" sites, these metrics offer insights into why an ad experience might be suboptimal, allowing for precise optimizations rather than broad interventions.
Availability and Accessibility: Tools for Analysis
The new ad metrics are immediately available through several channels, enabling developers and analysts to begin leveraging them without delay.
- CrUX API: Developers can programmatically access the ad metrics via the CrUX API. This allows for integration into custom dashboards, monitoring tools, and automated performance analysis workflows. The API provides aggregated, historical data for origins, making it possible to track trends and evaluate the impact of changes over time.
- CrUX History API: For a deeper historical perspective, the CrUX History API offers access to past data points, allowing users to analyze long-term trends in ad performance metrics for specific websites. This is invaluable for understanding the effectiveness of past optimization efforts and anticipating future impacts.
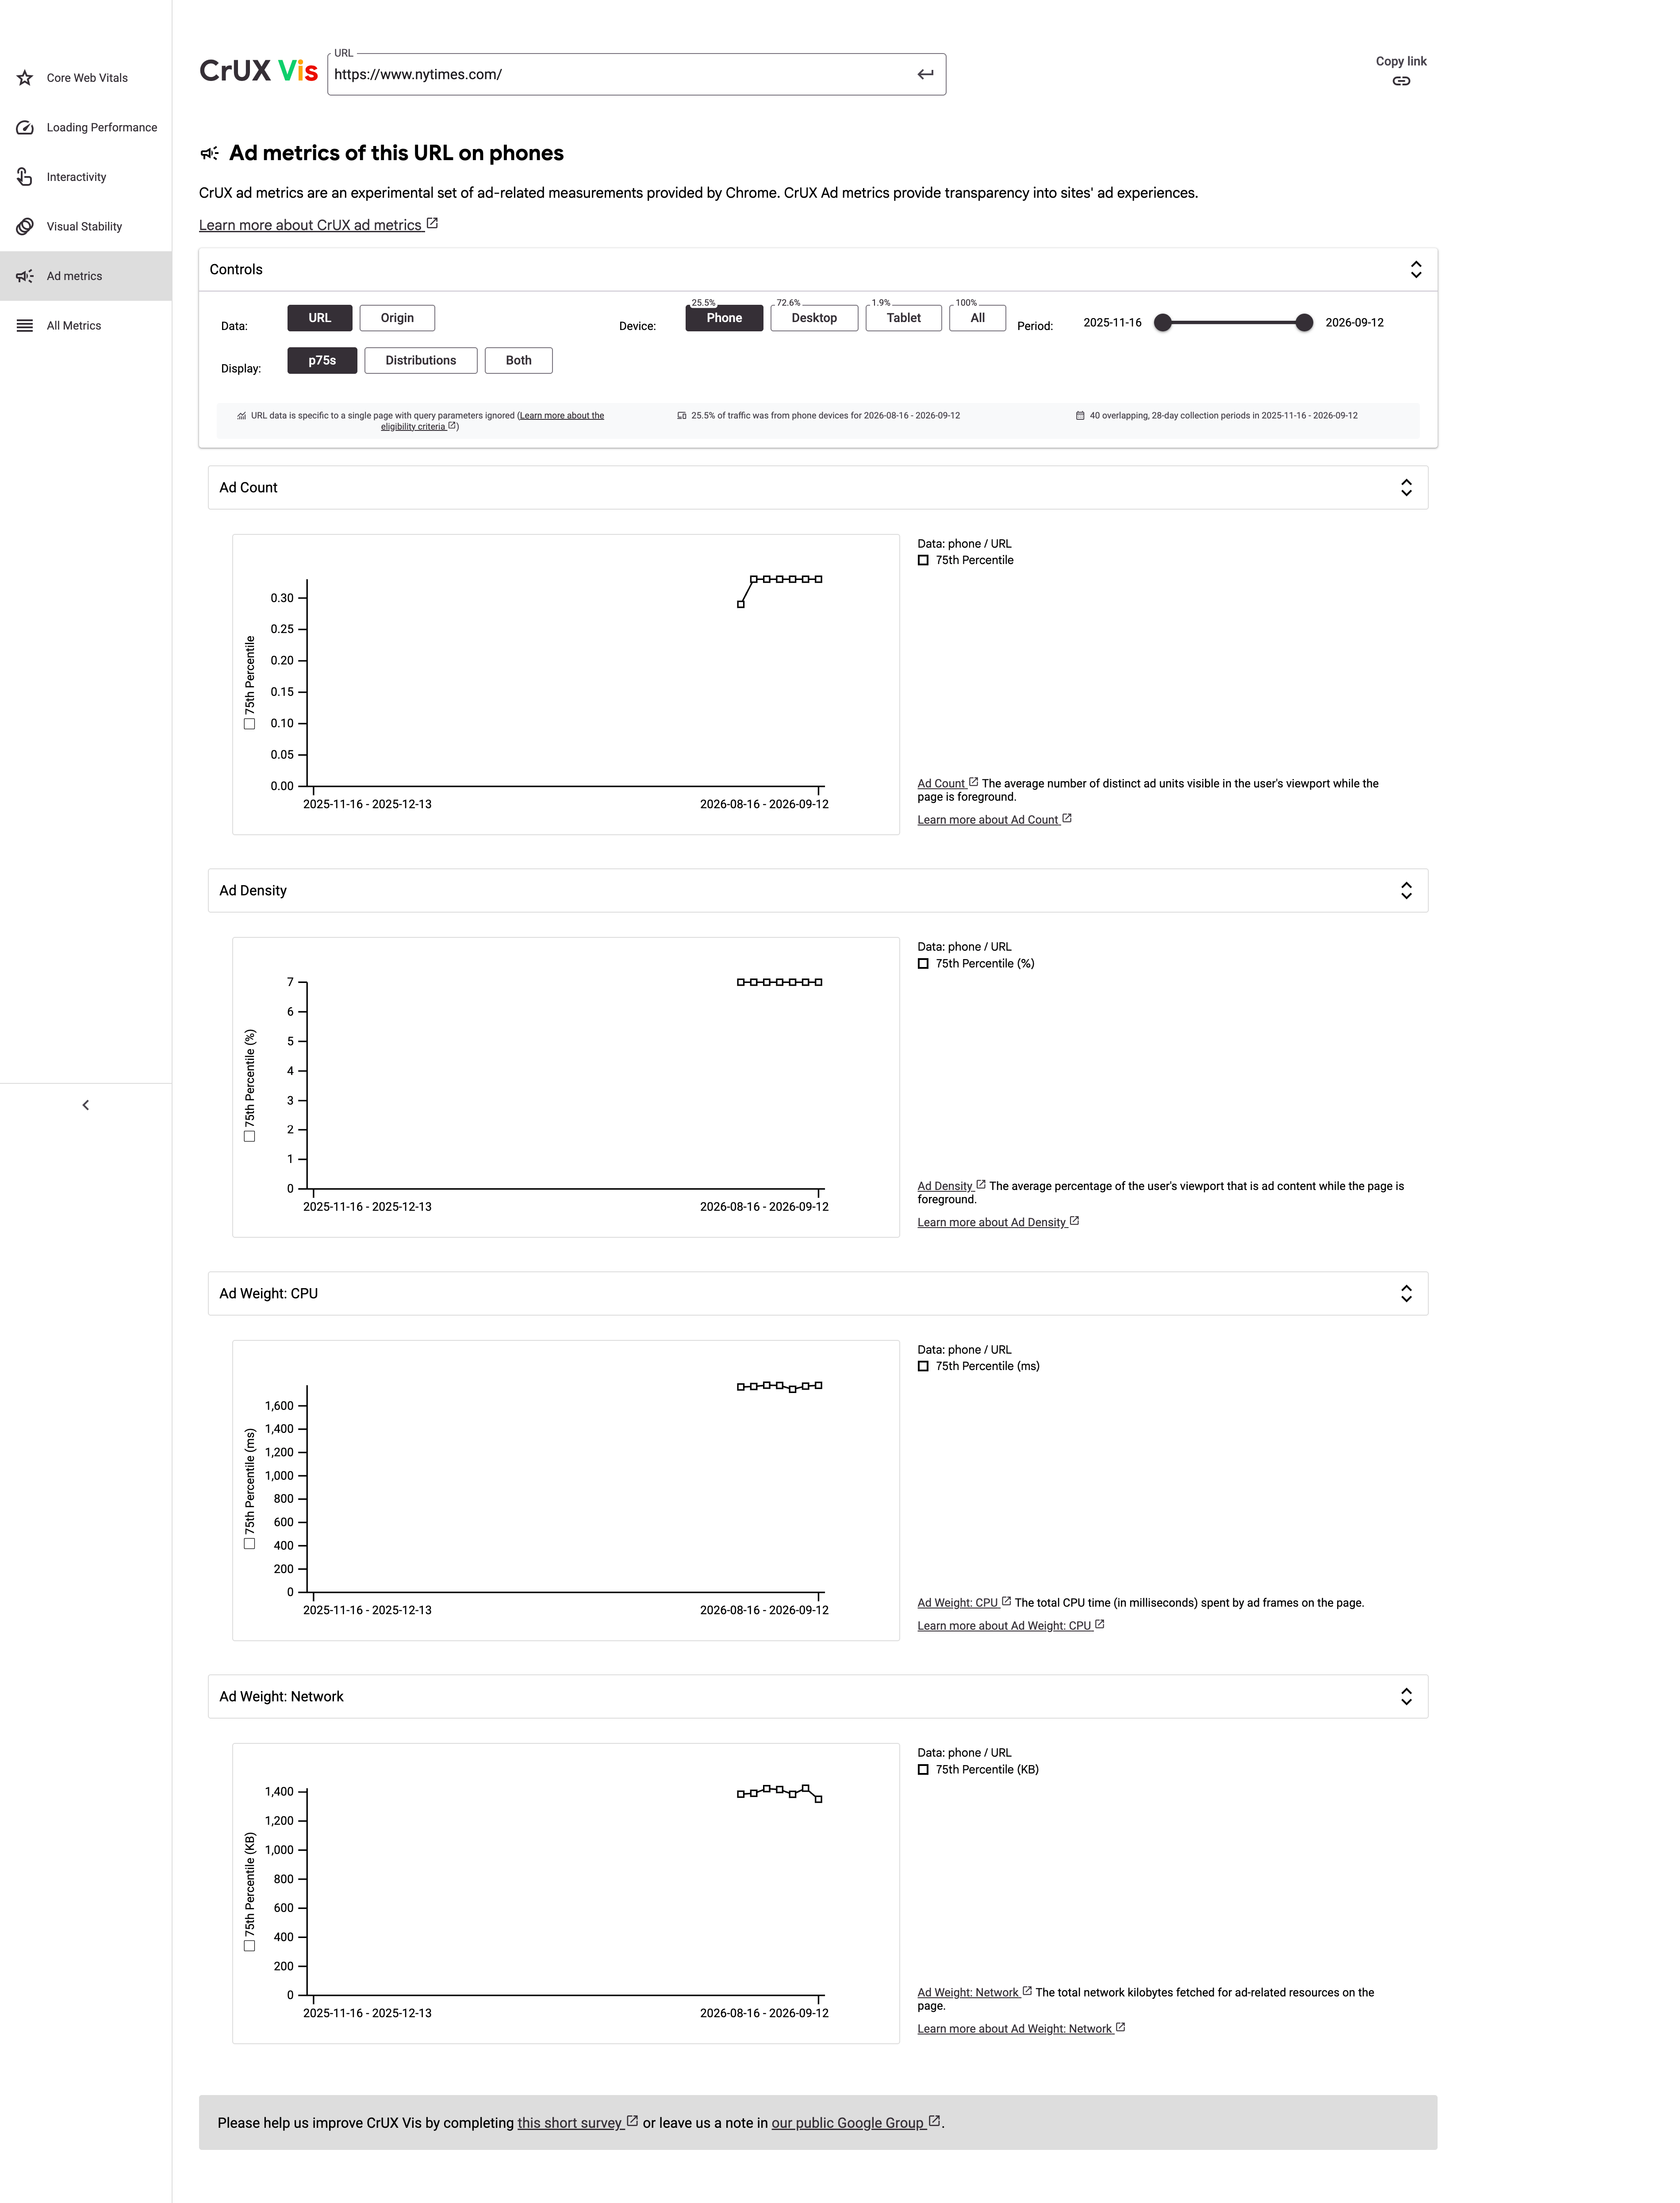
- CrUX Vis: For a more visual and interactive exploration, the ad metrics are accessible through CrUX Vis (cruxvis.withgoogle.com). This web-based tool provides a user-friendly interface to query CrUX data for any website, displaying various performance metrics, now including the experimental ad metrics. While the original article noted that some metrics were not reporting for select sites at the time of writing, Google’s continuous development suggests these integrations will become more robust. The ability to visualize these metrics, as demonstrated by the screenshot of the NY Times site, offers a clear and immediate understanding of a site’s ad performance profile.
Industry Reactions and Expert Recommendations
The announcement has garnered significant attention from the web performance and digital advertising communities. Glenn Gabe, a prominent SEO and digital marketing expert, strongly urged site owners to "run this TODAY," as quoted on X (formerly Twitter) on September 15, 2026. His recommendation highlights the immediate importance of these metrics for any site relying on advertising. He emphasized that "Every site owner running ads (especially a lot of ads) should run this TODAY :)" indicating the urgency for proactive assessment.
This sentiment resonates with the broader web performance community, which has long advocated for tools that offer granular insights into ad impact. Developers and performance engineers can now pinpoint specific issues related to ad implementation that might be dragging down their site’s overall performance. For publishers, this means moving beyond anecdotal observations or general performance scores to data-backed decisions about their ad strategy.
Implications for Publishers and Advertisers: A Strategic Shift
The introduction of these CrUX ad metrics heralds a potential shift in strategy for both publishers and advertisers.
For Publishers:
- Optimized Ad Strategy: Publishers will gain the ability to analyze the direct performance cost of their ad layouts and technologies. This could lead to a reassessment of ad unit sizes, positions, refresh rates, and the number of ads per page.
- Vendor Evaluation: The metrics offer a new lens through which to evaluate ad tech vendors. Publishers can compare the Ad Weight (Network) and Ad Weight (CPU) associated with different ad networks or demand-side platforms (DSPs) to choose partners that offer better performance profiles.
- Balancing Revenue and UX: With concrete data on ad impact, publishers can make more informed decisions about balancing revenue generation with maintaining a high-quality user experience, potentially leading to a "less is more" approach where fewer, better-performing ads yield comparable or even improved net results due to better user retention and SEO.
- Development Prioritization: Web development teams will likely incorporate these ad metrics into their performance budgeting and optimization workflows, treating ad performance as a critical component of overall site health.
For Advertisers:
- Contextual Performance Insights: Advertisers can better understand the performance environment in which their ads are displayed. An ad creative might perform differently on a site with high Ad Density or Ad Weight (CPU) compared to a leaner site.
- Creative Optimization: These metrics can inform creative development, pushing advertisers to design lighter, more efficient ad units that minimize network and CPU overhead.
- Transparency and Accountability: The data provides a layer of transparency, potentially fostering greater accountability from ad tech platforms to deliver ads that are not only effective but also performant.
The Future of Web Advertising and Performance
The experimental nature of these metrics suggests that Google will continue to refine and potentially expand them based on feedback and observed utility. This initiative points towards a future where ad performance is an integral part of overall web performance assessment, moving beyond simple ad blocking to a more nuanced, data-driven approach to ad quality.
This development aligns with broader industry trends focusing on user-centric design and the increasing importance of site speed and responsiveness. As users become more discerning and expectations for fast, seamless web experiences grow, publishers and advertisers who proactively optimize their ad implementations based on these new metrics will likely gain a competitive advantage. The CrUX ad metrics offer a powerful new tool in the ongoing quest to create a more efficient, enjoyable, and sustainable web for everyone.