
 rifanmuazin
Digital marketing and conversion rate optimization (CRO) professionals have long grappled with a persistent technical anomaly: the discrepancy between A/B testing scripts and web analytics platforms. In the contemporary landscape of data-driven decision-making, the transition to Google Analytics 4 (GA4) has intensified this friction. While minor variances between tools are expected, significant gaps—often exceeding 10%—can undermine the integrity of an entire testing program, leading to misallocated budgets and flawed strategic pivots.
The core of the issue lies in the fundamental architectural differences between how testing tools, such as Convert Experiences, and analytics platforms like GA4 capture and process user interactions. Industry experts, including veteran analyst Ryan Levander, have established a baseline “rule of thumb” for practitioners: if bottom-of-funnel conversion tracking, such as purchases, lead generations, or trial sign-ups, shows a discrepancy of more than 5% between systems, a deep-dive investigation is required. However, the origin of these gaps is frequently misunderstood, often attributed to simple configuration errors when the reality is rooted in the physical limitations of hardware and network infrastructure.

The Technical Conflict: Synchronous vs. Asynchronous Loading
To understand why data drift occurs, one must examine the browser’s execution lifecycle. Most robust A/B testing tools are designed to fire their scripts synchronously within the <head> tag of a website. This placement is intentional; the script must execute the moment the page begins to load to apply visual variations (flicker-free) and bucket the user into a specific test variation. Because the script is synchronous, it effectively “blocks” other processes until it has registered the visitor’s presence.
In contrast, GA4 operates on an asynchronous model. To prioritize user experience and page load speed, the GA4 tracking code is designed to load in the background, allowing the browser to render the visible elements of the page first. While this improves Core Web Vitals and general performance metrics, it creates a “timing window” where a user can interact with a site and depart before the GA4 beacon is successfully dispatched.
This architectural divergence means that the testing tool often “sees” the visitor before the analytics tool does. If a user’s connection is interrupted or if they navigate away quickly, the testing tool records a participant that GA4 never acknowledges.
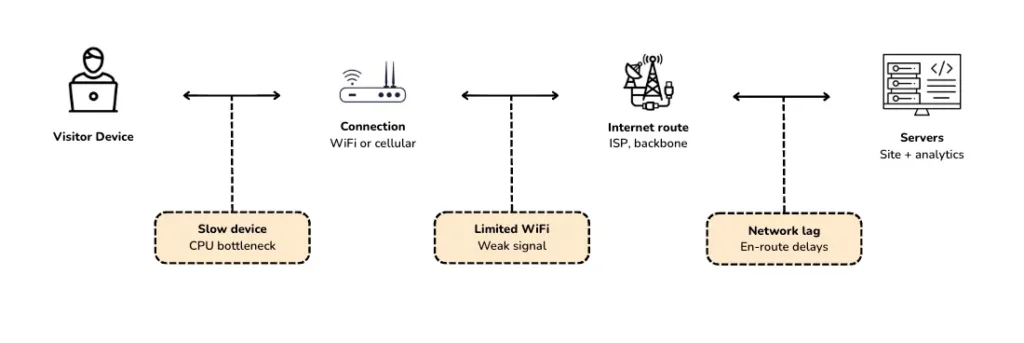
The Role of Global Network Infrastructure and Device Performance
A common misconception in the North American and European markets is the assumption of universal high-speed connectivity. While 5G adoption is a primary focus for telecommunications providers, the reality for the end-user is often different. According to a 2024 Opensignal report, even users with 5G-capable devices frequently spend a significant portion of their browsing time on LTE or 4G networks due to signal penetration issues and network congestion.
In the United States, as of 2025, approximately half of all mobile connections remain on sub-5G speeds. When factoring in global traffic, the prevalence of “slow” connections—defined by high latency and low bandwidth—becomes a dominant factor in data discrepancies.
Furthermore, device hardware plays a critical role in JavaScript execution. A five-year-old budget Android smartphone or a laptop operating on a congested public Wi-Fi network in a coffee shop processes scripts significantly slower than a flagship device on a dedicated fiber connection. On these “limited” devices, the browser’s main thread becomes a bottleneck. If GA4’s event is queued behind heavy image rendering or third-party ad scripts, the likelihood of the tracking event being dropped increases exponentially.

Research Findings: The 20-Second Delay and Funnel Anomalies
Recent longitudinal research conducted by technical teams at Convert, spanning nearly two years of debugging GA4 implementations, has shed light on specific patterns of data loss. The study utilized controlled environments to simulate various network conditions, from high-speed broadband to throttled 3G connections.
One of the most striking findings was the “20-second first-pageview delay.” In environments with slow 3G or 4G conditions, the research found that GA4’s initial page_view event—the fundamental building block of a session—frequently failed to fire for up to 20 seconds after the page began loading. For a modern consumer, 20 seconds is an eternity; most users will have either completed their intended action or bounced from the site long before that threshold is reached. Because the A/B testing tool fires synchronously, it captures these “fast-bouncing” users, while GA4 remains oblivious to their existence.
The research also identified a distinct “funnel-shaped” signature for network-related data loss. If data loss were random, the discrepancy would be uniform across all stages of a conversion funnel. However, the data shows that the largest gaps occur at the “funnel entry” (initial visit) and the “final conversion” (the thank-you page).

The middle of the funnel often appears deceptively accurate. This is because visitors who make it to the middle of a multi-step process have, by definition, a stable enough connection to have cleared the initial loading bottleneck. Once the initial GA4 session is established, subsequent events are more likely to be recorded accurately. This “survivorship bias” in the data can lead analysts to believe their middle-funnel metrics are healthy while the overall conversion rate is being calculated against an incomplete denominator.
The Google Tag Manager “Window Loaded” Trap
For years, a common piece of advice within the SEO and web performance community has been to trigger analytics tags on the “Window Loaded” event rather than the “Page View” event. The logic is sound from a performance perspective: by waiting until every image, subframe, and script has finished loading, the analytics tag does not compete for resources, thereby improving the site’s perceived speed.
However, from a data integrity perspective, this practice is hazardous. In slow-network scenarios, the “Window Loaded” event may take several seconds—or even minutes—to trigger. By shifting the GA4 trigger to this late stage, companies significantly widen the window of time in which a user can visit, interact, and leave without being tracked. This creates a scenario where a site appears to have higher engagement and conversion rates than it actually does, simply because the “unsuccessful” visitors were never recorded.

A Systematic Framework for Diagnosing Mismatches
When a discrepancy exceeds the acceptable 5-10% threshold, organizations should follow a structured diagnostic process to identify the root cause:
- Metric Alignment: Ensure the comparison is between “Convert Visitors” and “GA4 Users.” Comparing “Visitors” to “Sessions” is an “apples-to-oranges” error, as a single user can initiate multiple sessions, leading to an artificial inflation of GA4 numbers.
- Segmented Exposure: Utilize the integration features of the testing tool to filter GA4 reports. By looking only at visitors who triggered an
experience_impressionevent, analysts can ensure they are not comparing a specific test group against the entire site’s traffic. - Temporal Consistency: Align time zones and date ranges manually. It is also critical to wait at least 72 hours after a test period ends before finalizing a report, as GA4’s data processing latency can result in incomplete numbers for the most recent days.
- Device and Network Segmentation: Break down the discrepancy by device category. If the gap is negligible on desktop but substantial on mobile, network conditions and device performance are the confirmed culprits.
- Trigger Audit: Review Google Tag Manager (GTM) settings. If tags are firing on “Window Loaded,” they should be moved back to “Page View” or “Initialization” to capture more early-session data.
- Funnel Signature Analysis: Compare the percentage gap at each stage of the funnel. A gap that is wide at the top and bottom but narrow in the middle is the classic signature of network-induced data loss.
- Server-Side Verification: Whenever possible, cross-reference data with backend server logs or CRM records. Server-side data is the “source of truth” because it does not rely on the user’s browser or network stability to record a transaction.
Broader Implications for Business Strategy
The implications of “data drift” extend far beyond the technical realm. When A/B testing data and GA4 data disagree, it creates a crisis of confidence within marketing departments. Stakeholders may question the validity of a “winning” variation if the primary analytics tool does not show the same lift.
Furthermore, if GA4 is undercounting users on slow networks, it is likely undercounting a specific demographic—often those in rural areas or developing markets with less robust infrastructure. This can lead to an unintentional bias in optimization efforts, where websites are optimized for high-end users on fast connections while the needs of a significant portion of the audience are ignored because they are “invisible” in the analytics.

Ultimately, the goal for digital analysts should not be 100% data parity—a goal that is technically impossible in a decentralized web environment. Instead, the focus should be on understanding the why behind the drift. By recognizing that network conditions and loading sequences are the primary drivers of these gaps, businesses can make more informed decisions, treat their testing tools as the primary source for experiment behavior, and use GA4 for broader longitudinal trends.
In the era of GA4, the “truth” is rarely found in a single number, but rather in the patterns that emerge when one understands the technical friction between a user’s device and the cloud. As web technologies continue to evolve, the ability to interpret these discrepancies will remain a hallmark of a sophisticated, data-literate organization.








