

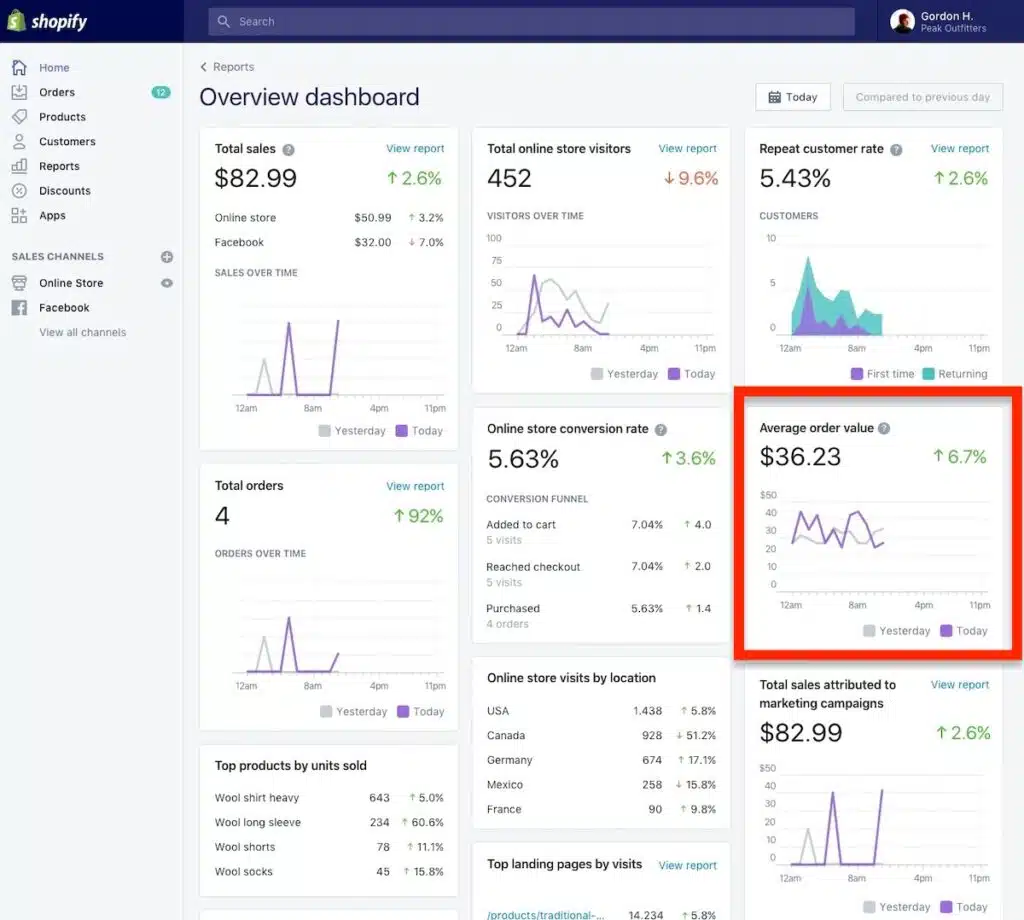
Conversion Rate Optimization (CRO) Key Performance Indicators (KPIs) represent the essential quantitative measurements that organizations utilize to determine whether modifications to their digital presence are yielding tangible improvements in business performance. In an increasingly competitive digital landscape, these metrics serve as the primary bridge between website user behavior and bottom-line revenue. Whether a company is refining a product page, streamlining a lead generation form, or overhauling a checkout sequence, KPIs provide the empirical evidence required to validate the success or failure of these initiatives.
A robust CRO KPI is distinguished by three specific characteristics: it must be measurable, it must be directly influenced by website changes, and it must align with overarching corporate objectives. Without these parameters, businesses risk focusing on "vanity metrics" that may show increased activity without contributing to actual growth.
The Evolution of Digital Measurement: From Pageviews to Outcome-Based KPIs
The history of conversion tracking has undergone a significant transformation over the last three decades. In the early era of the internet, digital success was often measured by "hits" or simple pageviews. As the e-commerce sector matured in the 2010s, the focus shifted toward the "conversion rate" as the singular metric of importance. However, modern digital strategy has evolved further. With the retirement of Universal Analytics and the mandatory transition to Google Analytics 4 (GA4) in July 2023, the industry has moved toward an event-based tracking model.
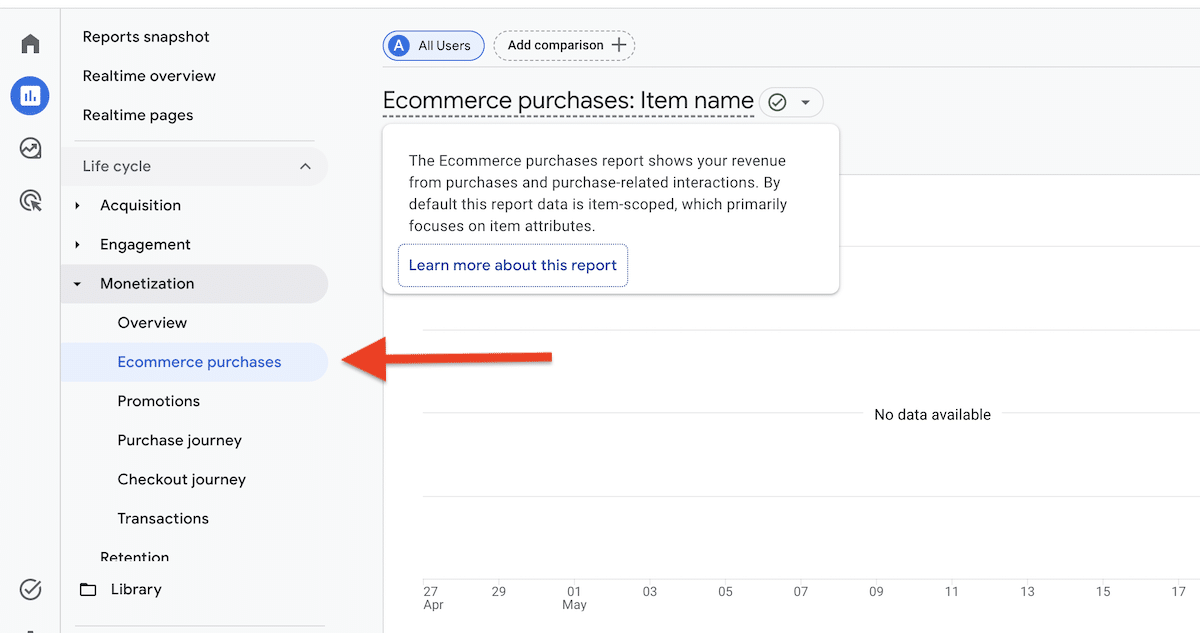
This shift reflects a broader understanding that not all traffic is equal. Contemporary analysts now distinguish between general CRO metrics—such as scroll depth, clicks, and bounce rates—and true CRO KPIs. While metrics are useful for diagnosing specific usability issues, KPIs are reserved for measuring outcomes that align with business goals, such as purchase conversion rates, revenue per visitor (RPV), and qualified lead rates.
Primary Revenue and Conversion KPIs
At the core of any CRO strategy are the KPIs that directly track the influx of capital or high-value commitments. These metrics are the most scrutinized by executive leadership as they provide a direct reflection of return on investment (ROI).
1. Purchase Conversion Rate
The conversion rate remains the most fundamental KPI in the digital marketer’s toolkit. Calculated by dividing total conversions by total visitors and multiplying by 100, this figure provides an immediate snapshot of a page’s effectiveness. In the current market, the average e-commerce conversion rate typically hovers between 2% and 3%, though high-performing niche brands often achieve upwards of 5%.
2. Revenue Per Visitor (RPV)
RPV is a sophisticated metric that accounts for both the frequency of purchases and the value of those purchases. It is calculated by dividing total revenue by total visitors. Industry analysts suggest that RPV is often more valuable than conversion rate alone because it identifies whether a site is extracting more value from its existing traffic. For example, a site might see a slight drop in conversion rate but a significant spike in RPV if customers are purchasing more expensive items.
3. Average Order Value (AOV)
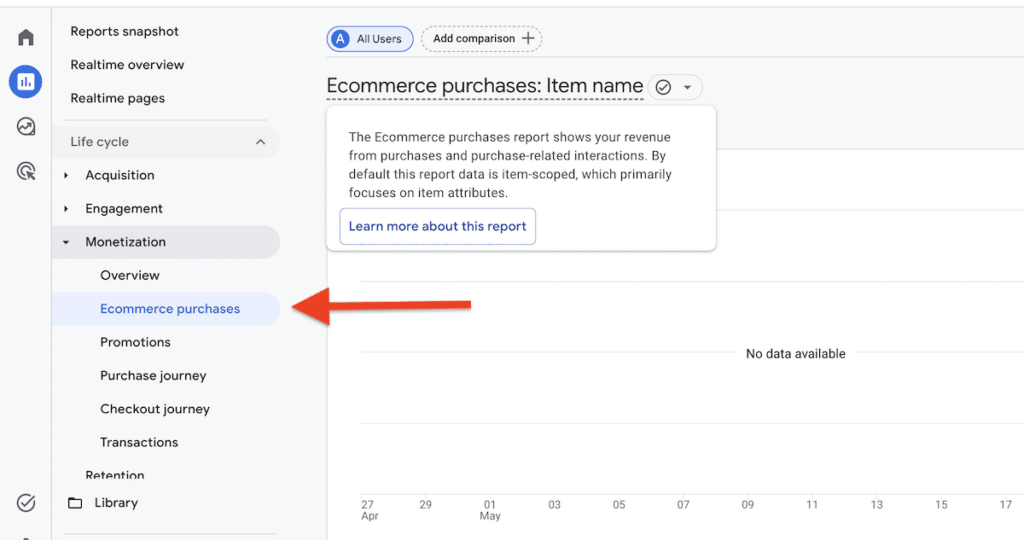
AOV measures the average dollar amount spent each time a customer places an order. This KPI is critical when testing upsells, cross-sells, or free shipping thresholds. If a business implements a "Buy Two, Get One Free" offer, the AOV will be the primary indicator of whether the promotion is successfully encouraging higher spending per transaction.
Funnel Velocity and Friction Point Analysis
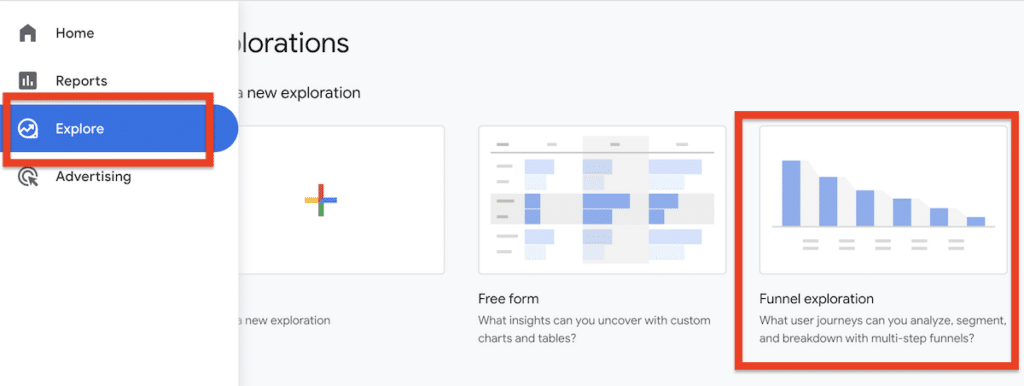
To understand why a conversion rate is high or low, organizations must look at the "micro-conversions" that occur throughout the customer journey. These KPIs isolate specific stages of the funnel to identify where potential customers are dropping off.
Add-to-Cart and Cart-to-Checkout Rates
The add-to-cart rate is a primary indicator of product page effectiveness. If visitors are reaching a product page but not adding items to their cart, the issue likely lies in product descriptions, imagery, or pricing. Conversely, the cart-to-checkout rate measures the transition from the shopping bag to the payment screen. A low rate here often signals "sticker shock" regarding shipping costs or a lack of trust in the site’s security.
Checkout Completion Rate
According to industry data from the Baymard Institute, the average documented online shopping cart abandonment rate is nearly 70%. The checkout completion rate—calculated by dividing total purchases by checkout starts—helps businesses isolate friction within the final payment steps. Common inhibitors include forced account creation, excessive form fields, and a lack of diverse payment options like digital wallets.
Measuring Lead Quality in B2B and SaaS Contexts
For B2B and Software-as-a-Service (SaaS) companies, the website’s role is rarely to close a sale immediately. Instead, it serves to generate leads. In this context, volume-based metrics can be misleading. Recent marketing data suggests that approximately 40% of B2B marketers now prioritize lead quality and marketing-qualified leads (MQLs) over total lead volume.
1. Qualified Lead Rate
This KPI measures the percentage of form submissions that meet specific "fit" and "intent" criteria. For instance, if a landing page generates 100 leads but only 20 represent companies within the target industry with the appropriate budget, the qualified lead rate is 20%. CRO tests that simplify forms often increase total lead volume but can inadvertently decrease the qualified lead rate by attracting low-intent users.
2. Lead-to-Opportunity and Lead-to-Customer Rates
These metrics track the progression of a lead through the sales cycle. The lead-to-opportunity rate identifies how many leads actually progress to a formal sales conversation. The lead-to-customer rate is the ultimate measure of lead quality, though it often requires a longer tracking period—sometimes 30 to 90 days—to account for the length of professional sales cycles.
The Strategic Framework: Choosing the Right Metrics for Experimentation
The selection of a KPI must be tailored to the specific initiative being tested. Digital strategy experts recommend a hierarchical approach to measurement: Primary KPIs, Diagnostic KPIs, and Guardrail KPIs.
The Primary KPI
The primary KPI is the "north star" of a test. It is the single metric that determines success. If a team is redesigning a checkout page, the primary KPI should be the checkout completion rate. Deciding this metric before a test begins is essential to avoid "data dredging," where teams search through various metrics after a test to find any positive result to justify their work.
Diagnostic KPIs
These metrics provide the "why" behind the results of the primary KPI. If a test shows a lift in revenue, diagnostic KPIs like "average session duration" or "pageviews per session" can help explain whether users are more engaged or simply moving through the funnel faster.
Guardrail KPIs
Guardrail metrics are designed to protect the business from unintended negative consequences. Microsoft’s experimentation team has long advocated for the use of guardrails to ensure that an improvement in one area does not cause a catastrophe in another. For example, a company might offer a massive discount to increase its conversion rate (the primary KPI). However, they must track "gross margin" as a guardrail to ensure the discount isn’t making the sales unprofitable. Similarly, in SaaS, "onboarding completion" might be a primary KPI, but "early churn" must be the guardrail to ensure that faster onboarding isn’t leading to confused users who cancel their subscriptions immediately.
Industry Reactions and Future Implications
The shift toward more nuanced CRO KPIs has drawn reactions from data analysts and privacy advocates alike. With the increasing prevalence of data privacy regulations such as GDPR and CCPA, and the phasing out of third-party cookies, the industry is seeing a move toward "first-party data" tracking.
Growth specialists argue that the future of CRO lies in "Customer Lifetime Value" (CLV) rather than single-session conversions. Analysts suggest that as acquisition costs continue to rise, the most successful companies will be those that use CRO KPIs to optimize for long-term retention and repeat purchases rather than one-off transactions.
Furthermore, the integration of Artificial Intelligence (AI) into analytics platforms is beginning to automate the identification of these KPIs. AI-driven tools can now highlight anomalies in checkout completion rates or add-to-cart rates in real-time, allowing businesses to react to friction points much faster than traditional manual analysis allowed.
Conclusion and Reporting to Stakeholders
The final stage of a successful CRO strategy is the communication of these KPIs to stakeholders. Effective reporting avoids technical jargon and focuses on how these numbers impact business health. An executive-level dashboard typically highlights RPV and Customer Acquisition Cost (CAC), while a marketing-focused dashboard might dive deeper into lead quality and funnel drop-off points.
By maintaining a disciplined focus on KPIs that align with business goals, organizations can ensure that their website optimizations are not merely aesthetic changes, but strategic drivers of sustainable growth. In the modern digital economy, the ability to accurately measure and act upon these numbers is often the deciding factor between market leaders and their competitors.







