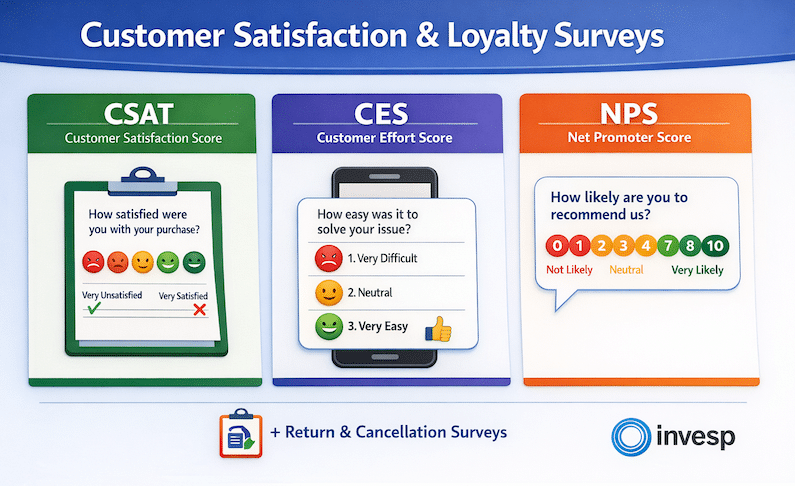
In the contemporary digital economy, businesses frequently encounter a phenomenon where high-quality traffic fails to translate into meaningful transactions. While quantitative analytics platforms such as Google Analytics, Mixpanel, and Amplitude provide a granular view of user behavior—documenting where users click, how far they scroll, and at which point they exit—they fundamentally fail to address the underlying psychological motivations behind these actions. This "data gap" represents a significant hurdle for conversion rate optimization (CRO). To bridge this divide, industry leaders are increasingly turning to qualitative customer feedback surveys, not as a general feedback mechanism, but as a surgical tool designed to diagnose specific points of friction within the customer journey.
The current landscape of e-commerce and Software-as-a-Service (SaaS) is defined by rising customer acquisition costs (CAC) and intensifying competition. In this environment, the ability to understand "why" a user abandons a cart or fails to activate a trial is more valuable than simply knowing that they did so. Market research indicates that by implementing targeted, moment-specific surveys, brands can uncover the doubts, unanswered questions, and technical hurdles that quantitative data obscures.
The Chronology of the Digital Customer Journey and Associated Friction Points
The path from initial discovery to long-term retention is a multi-stage process, with each phase presenting unique psychological barriers. Effective survey implementation follows this chronological progression, addressing specific concerns at the exact moment they arise.
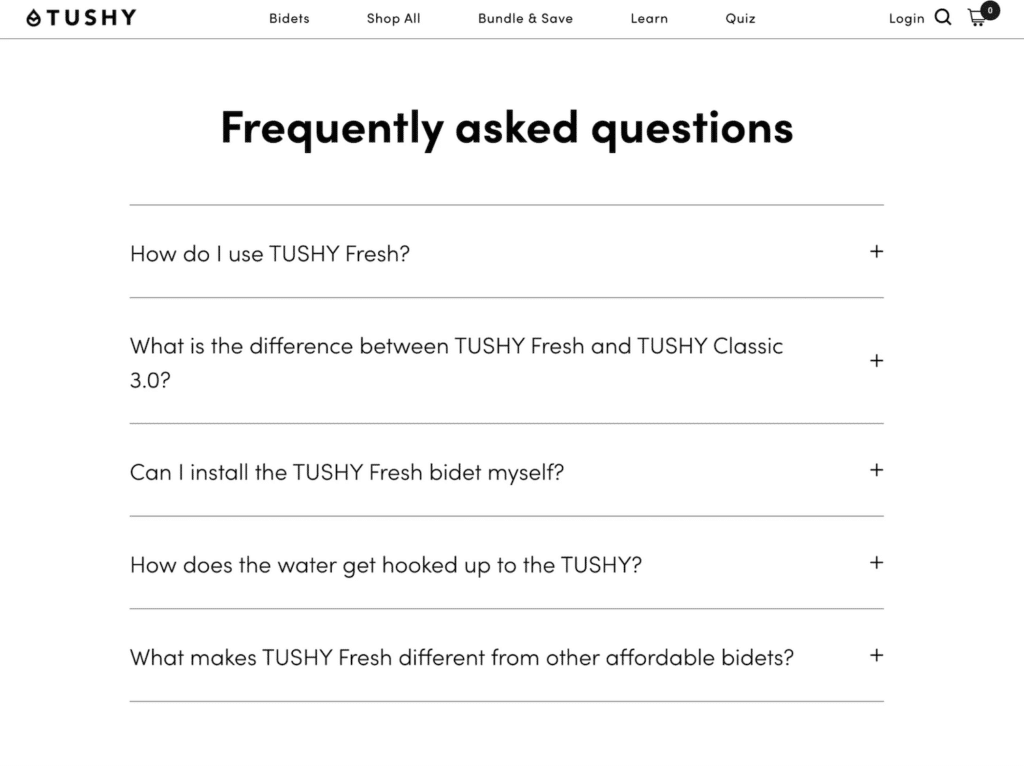
The journey typically begins on the product page. According to the Baymard Institute’s latest e-commerce UX benchmark, approximately 52% of desktop sites and 62% of mobile sites possess "mediocre" or poor product page user experiences. At this stage, the primary friction is informational. Shoppers often hesitate to add items to their carts because the page fails to answer critical questions regarding product specifications, compatibility, or shipping timelines. Industry case studies, such as that of the bidet brand TUSHY, demonstrate that addressing these "pre-purchase" questions directly on the page through proactive FAQs and targeted surveys can significantly reduce hesitation.
The second critical juncture is the checkout process. This is the stage where intent is highest, yet abandonment remains a systemic issue. Data from the Baymard Institute suggests an average cart abandonment rate of 70.19%. The transition from the product page to the final payment is often marred by "transactional shock"—the sudden appearance of high shipping costs, mandatory account creation, or concerns over payment security.
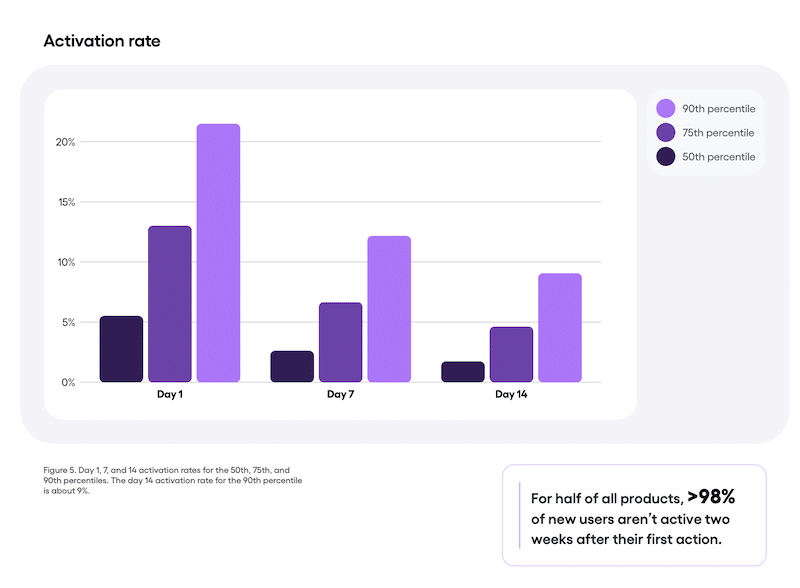
Following a successful transaction, the focus shifts to attribution and retention. For SaaS companies, the "activation" phase is the most perilous. Amplitude’s Product Benchmark Report reveals a stark reality: by the 14th day after sign-up, the median product retains only about 2% of new users. Even top-tier performers struggle to maintain activity above 9%. Here, the friction is functional; users often find the setup process too complex or fail to reach the "Aha! moment" where the product’s value becomes self-evident.
Finally, the post-purchase or post-cancellation phase provides insights into the "expectation gap." When a customer returns a product or cancels a subscription, it signifies a mismatch between the marketed promise and the actual experience. The National Retail Federation (NRF) reported that retailers expected approximately 16.9% of annual sales to be returned in 2024, with that figure projected to rise for online sales in 2025.
Supporting Data: The Cost of Ignoring Qualitative Feedback
The financial implications of conversion friction are immense. The NRF and Happy Returns report indicates that retail returns totaled approximately $890 billion in 2024. Furthermore, research by Bain & Company suggests that a 5% increase in customer retention can lead to a profit increase of 25% to 95%. These figures underscore the necessity of diagnostic surveys.
In the checkout phase, the primary drivers of abandonment are consistently identified as:
- High extra costs (shipping, taxes, fees): 48%
- The requirement to create an account: 26%
- Delivery speed being too slow: 23%
- Security concerns regarding credit card information: 13%
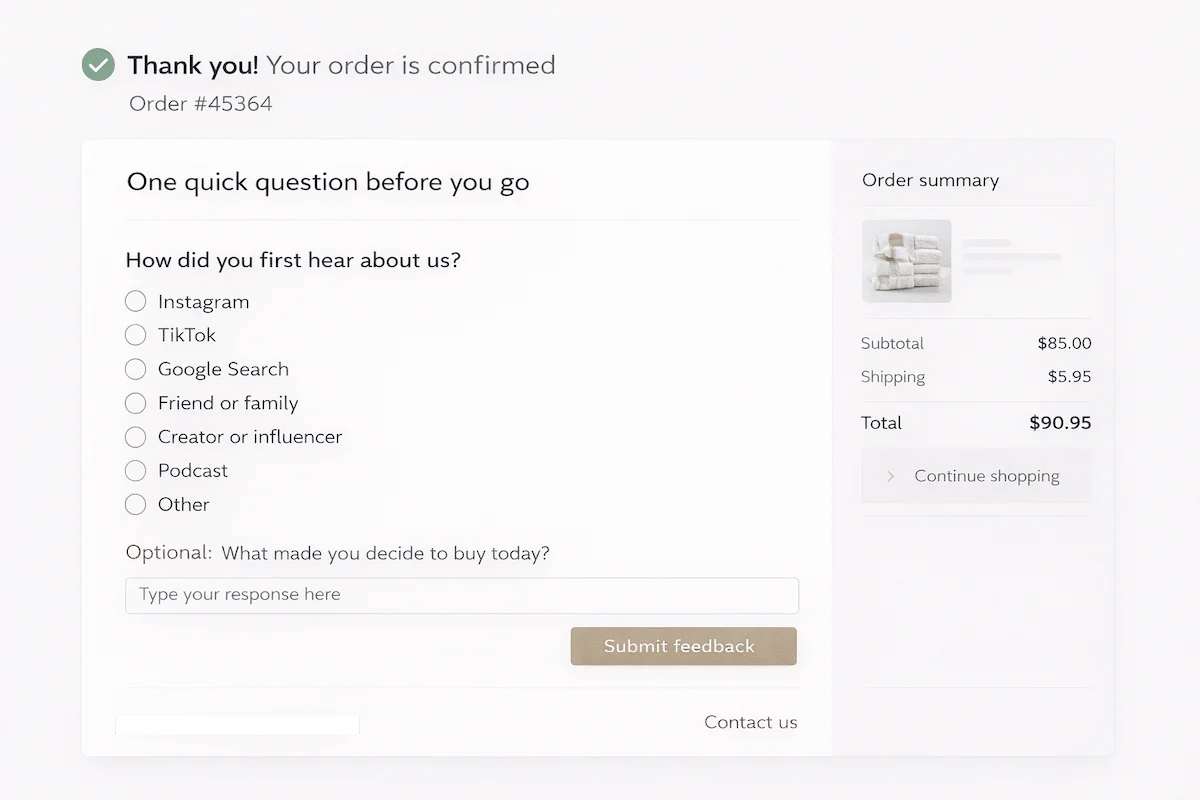
By utilizing a "Before You Go" survey at the moment of exit intent, companies can distinguish between users who are merely "window shopping" and those who are being driven away by fixable technical or policy issues.
Expert Methodologies: Designing High-Impact Survey Templates
To move beyond vague feedback, CRO specialists recommend five specific survey types, each tailored to a different stage of the funnel.
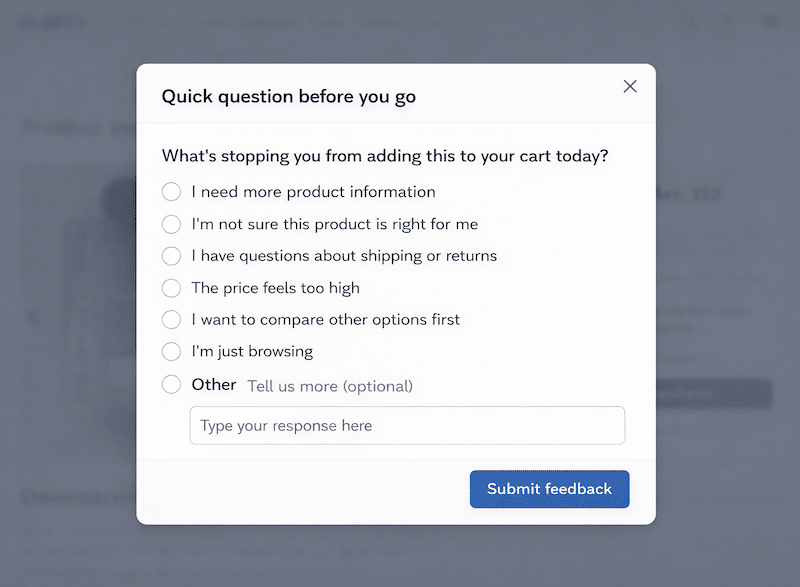
1. The Product Page Exit Survey
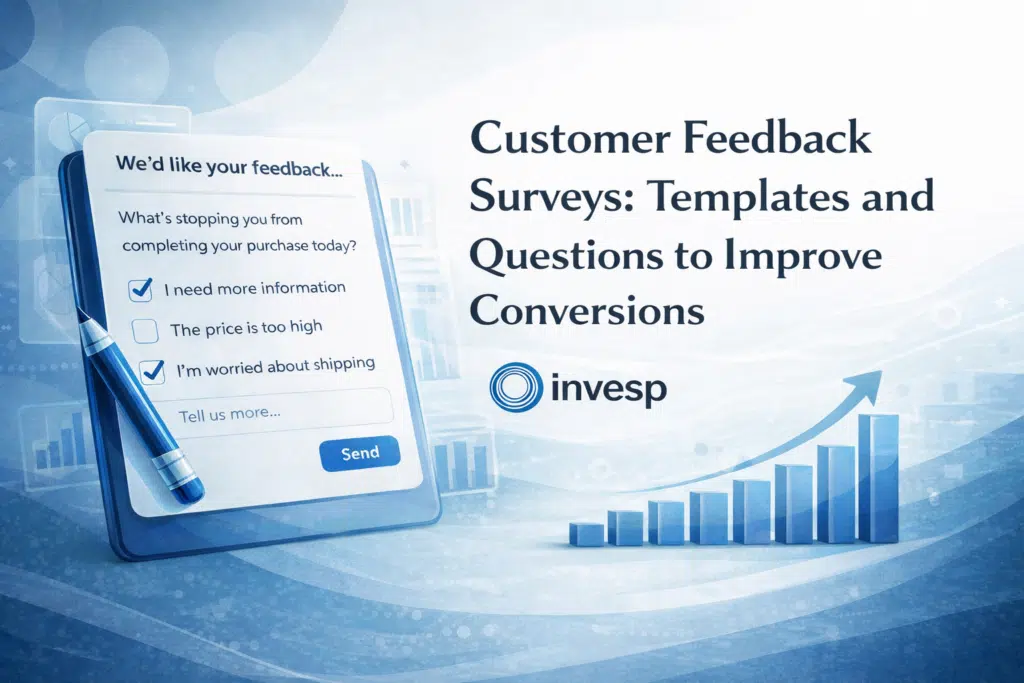
When a user reaches a product page but fails to add an item to the cart, the most effective question is: "What’s stopping you from adding this to your cart today?"
By providing multiple-choice options—such as "I’m worried about the fit/size," "I have a question about shipping," or "I’m just looking for now"—businesses can categorize friction. If data shows a high percentage of "unanswered questions," the solution is not a marketing change but a content update to the product description.
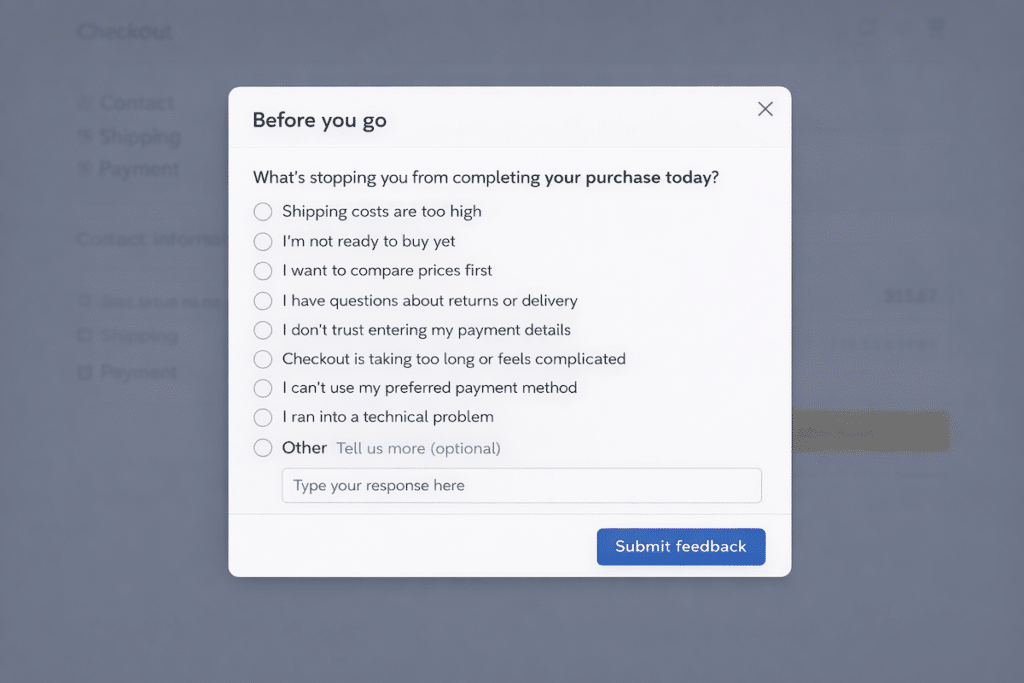
2. The Checkout Abandonment Survey
At this stage, questions must be direct. "What’s stopping you from completing your purchase today?" common responses often reveal that the shipping cost was higher than expected or that a preferred payment method (such as Apple Pay or PayPal) was missing. Addressing these technical or financial hurdles provides a direct path to revenue recovery.
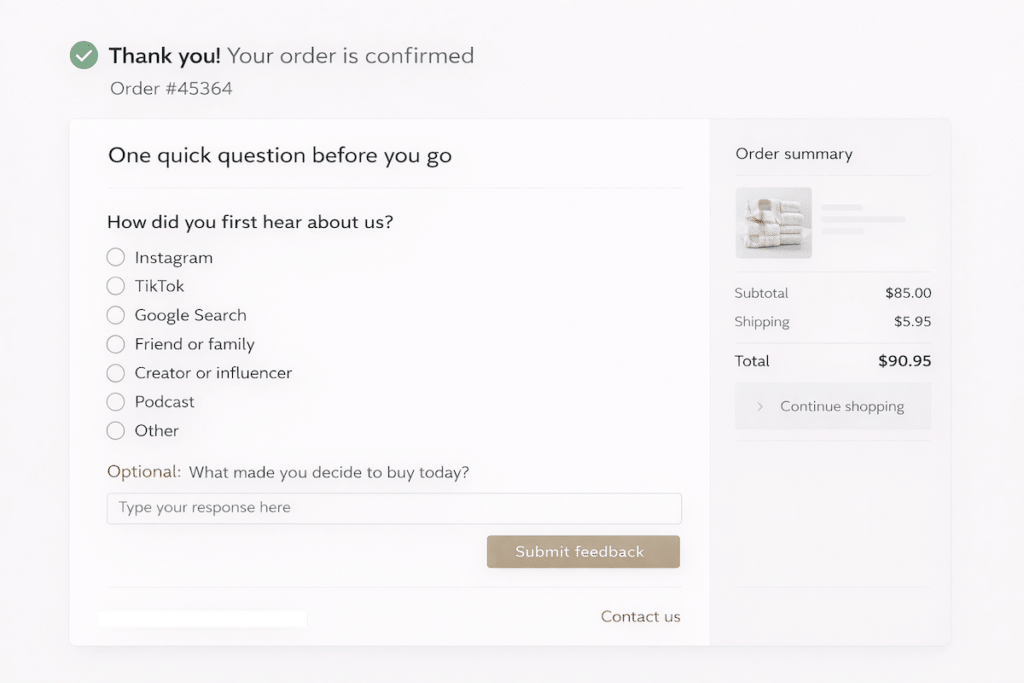
3. The Post-Purchase Attribution Survey
Understanding the "How Did You Hear About Us" (HDYHAU) metric is vital for budget allocation. Analytics often misattribute "dark social" or word-of-mouth traffic to "Direct" or "Organic Search." For example, the brand Weezie discovered through post-purchase surveys that 35% of its business originated from word-of-mouth, a signal that was invisible in standard tracking cookies. This data allows for more confident investment in brand-building and community initiatives.
4. The Trial Activation Survey
For SaaS providers, the question "What’s stopping you from getting started today?" identifies the barrier to entry. If users select "I don’t know what to do first," the company must refine its onboarding flow. If they select "I don’t have time to set this up right now," it suggests a need for a "concierge" onboarding service or a more simplified initial configuration.
5. The Churn and Return Survey
This survey addresses the "why" behind the $890 billion returns problem. By asking for the "main reason for your return or cancellation," brands can identify systemic product flaws. If "poor fit" is the recurring theme in apparel returns, the brand may need to implement a virtual sizing tool or update its size charts.
Professional Standards for Survey Construction
To ensure the integrity of the data collected, organizations must adhere to strict methodological standards. Journalistic and scientific rigor in survey design prevents the collection of "noisy" or biased data.
First, surveys must prioritize specificity. Vague questions like "How was your experience?" yield actionable insights only in rare cases. Instead, questions should be tied to a specific action or inaction. Second, the use of "Low-Effort Responses" is critical. Providing pre-defined multiple-choice options based on known friction points increases participation rates. However, including an "Other" category with an optional text field ensures that the company does not miss novel issues.
Third, timing is paramount. A survey presented too early in a session is perceived as an intrusion; a survey presented too late (via email days later) suffers from memory decay. Triggering surveys based on "exit intent" or "time on page" ensures the feedback is captured while the user’s motivation—or frustration—is still fresh.
Broader Implications for Business Strategy and Market Resilience
The shift toward qualitative-heavy CRO reflects a broader maturation of the digital commerce sector. As privacy regulations like GDPR and CCPA, along with technical shifts like the phasing out of third-party cookies, make traditional tracking more difficult, "zero-party data"—information intentionally shared by the customer—becomes the gold standard for personalization and optimization.
Furthermore, the implementation of these surveys has a profound impact on organizational alignment. When a survey reveals that 40% of checkout abandonments are due to slow delivery times, it provides the marketing department with the data needed to lobby for logistics improvements. When post-purchase data shows a high volume of referrals from a specific niche podcast, the media buying team can adjust their spend with precision.
In conclusion, customer feedback surveys are no longer merely a tool for customer service; they are a fundamental component of business intelligence. By systematically diagnosing friction across the product page, checkout, trial, and return phases, companies can move beyond the "what" of analytics and master the "why" of consumer behavior. This transition from reactive troubleshooting to proactive optimization is what separates market leaders from their competitors in an increasingly crowded digital marketplace. The integration of qualitative insights into the CRO process represents the most sustainable path to long-term profitability and customer-centric growth.