 Siti Muinah
The evolution of digital analytics has reached a new milestone in user accessibility with the introduction of Scheduled Exports for Heatmap data, a feature designed to streamline the reporting process for marketing teams, UX designers, and data analysts. This update allows users to bypass the manual process of logging into the dashboard to extract visual and quantitative data, instead enabling a "set-and-forget" system that delivers critical insights directly to a user’s inbox at predetermined intervals. The feature encompasses the full spectrum of data formats available within the platform, including visual Heatmap screenshots as images, comprehensive List reports in CSV format, and sophisticated AI-generated exports in JSON format. By automating the distribution of these assets, the update addresses a long-standing friction point in data-driven decision-making: the time-consuming nature of manual data collection and report generation.
The Shift Toward Automated Data Democratization
In the contemporary digital landscape, the ability to react quickly to user behavior is a competitive necessity. Heatmaps have long served as a cornerstone of conversion rate optimization (CRO) by providing a visual representation of where users click, scroll, and hover on a webpage. However, the utility of this data is often bottlenecked by the administrative overhead required to share it across departments. Prior to the rollout of Scheduled Exports, stakeholders were often required to have direct access to the analytics platform or rely on a designated data manager to manually capture screenshots and export spreadsheets for weekly meetings.
The new scheduling functionality effectively democratizes this data. By allowing exports to be sent automatically, organizations can ensure that every relevant stakeholder—from product managers to external clients—receives the latest visual evidence of user engagement without manual intervention. This shift from a "pull" model of data retrieval to a "push" model ensures that insights remain top-of-mind for decision-makers, fostering a more proactive optimization culture.
Technical Specifications and Multi-Format Support
One of the most significant aspects of this update is the inclusion of all primary file formats supported by the platform. This multi-format approach recognizes that different departments require data in different ways to fulfill their specific roles.
Visual Screenshots for Presentation and UX
For UX designers and marketing executives, the visual Heatmap screenshot (delivered as an image file) is the most potent tool. These images provide an immediate, intuitive understanding of user intent. By scheduling these to arrive in an inbox, a designer can begin their Monday morning by reviewing how a new call-to-action button performed over the weekend without needing to navigate complex dashboard menus.
CSV List Reports for Deep Quantitative Analysis
Data analysts and growth engineers often require raw numbers to perform statistical significance testing or to combine Heatmap data with other metrics like bounce rates or average order value. The Scheduled Export of List reports in CSV format allows these professionals to receive structured data that can be immediately imported into Excel, Google Sheets, or more advanced business intelligence (BI) tools. This facilitates a deeper level of analysis that goes beyond the "where" of a click to the "how many" and "at what rate."
JSON AI Exports for Technical Integration
The inclusion of AI Exports in JSON format is a forward-looking addition that caters to the needs of developers and data scientists. JSON (JavaScript Object Notation) is a lightweight data-interchange format that is easily readable by machines. By scheduling JSON exports, companies can automate the flow of AI-interpreted heatmap data into internal databases or custom-built dashboards. This allows for the integration of behavioral insights with backend performance data, providing a holistic view of the technical and behavioral ecosystem of a website.
Step-by-Step Implementation and User Interface
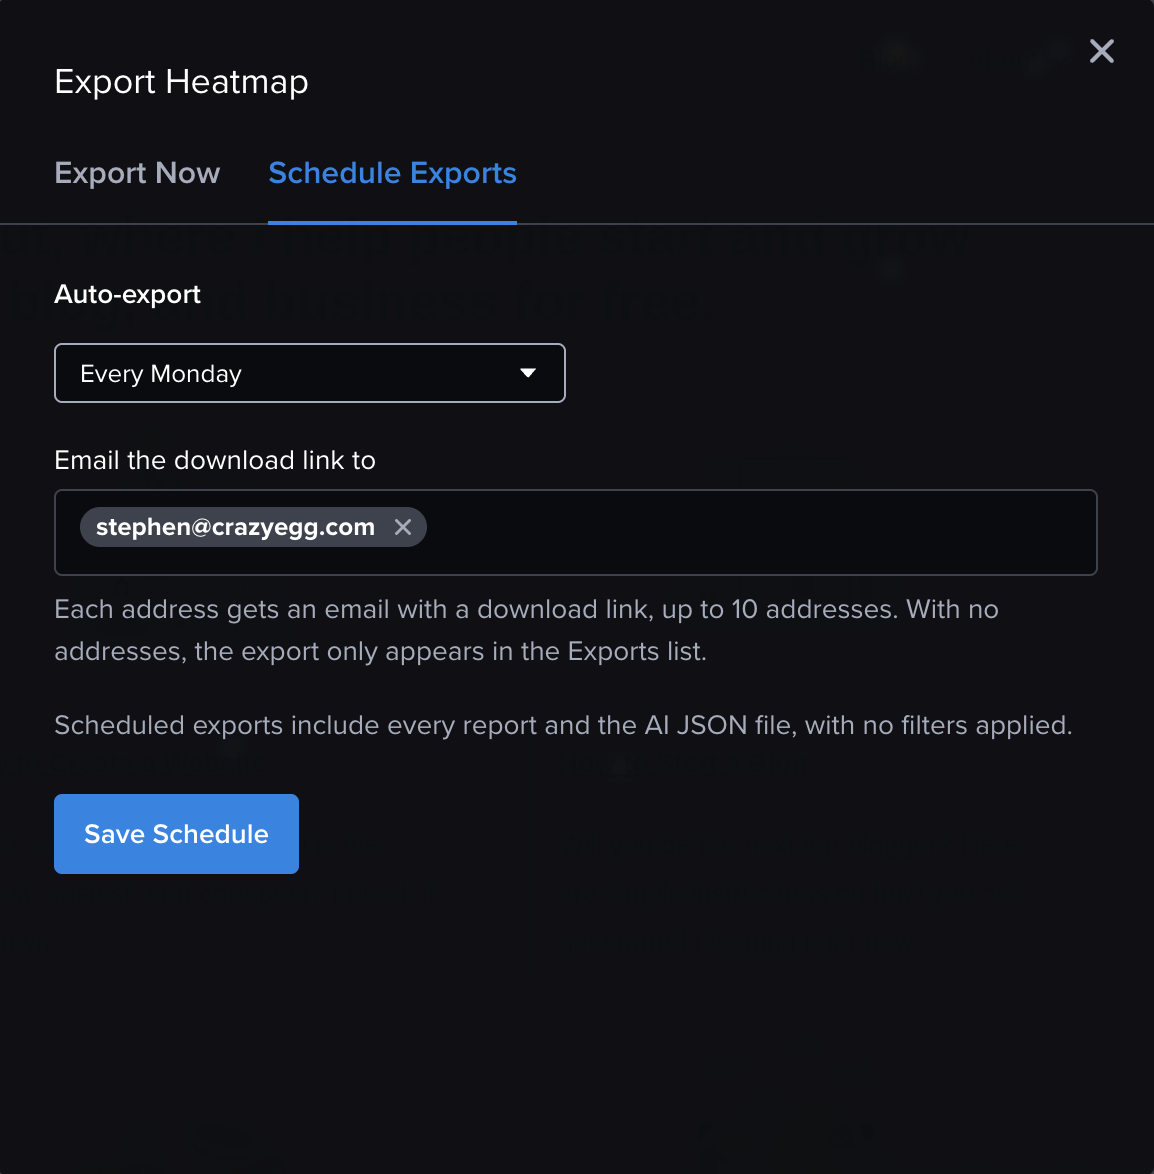
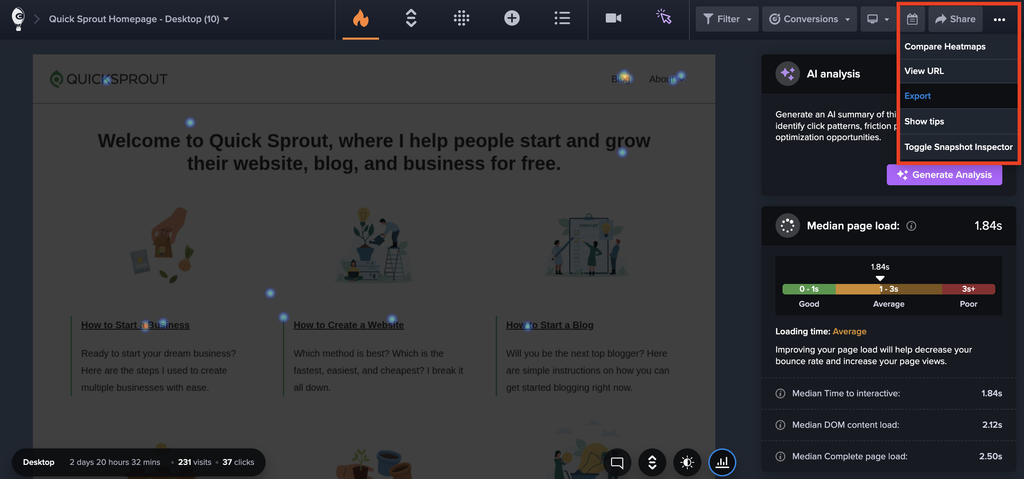
The integration of Scheduled Exports into the existing user interface has been designed with a focus on simplicity and minimal learning curves. To activate the feature, users must navigate to any existing Heatmap within their account. In the top-right corner of the interface, a dropdown menu provides the "Export" option. Upon selection, a new modal window appears, featuring a dedicated "Schedule Exports" tab.
Within this tab, users can configure the specific parameters of their automated reports. This includes selecting the desired file formats and, crucially, setting the frequency of delivery. While specific frequency options typically range from daily to monthly, the flexibility allows teams to align their data delivery with their internal sprint cycles or reporting cadences. Once configured, the system handles the rendering of the heatmap and the compilation of the data files in the background, ensuring that the email is dispatched at the exact time requested.
Chronology of Product Development in Web Analytics
The introduction of automated exports is the latest step in a decades-long trajectory of web analytics evolution. To understand the significance of this update, one must look at the timeline of how behavioral data has been handled:
- The Era of Log Files (1990s): Early web analytics relied on server log files. Data was purely quantitative and required significant technical expertise to interpret. There was no visual component to user behavior.
- The Rise of JavaScript Tagging (Early 2000s): Tools began using browser-side scripts to track interactions. This led to the birth of the first Heatmaps, which were often static and required long processing times.
- Real-Time and Dynamic Heatmapping (2010s): As websites became more interactive (SPAs, AJAX), heatmap technology evolved to track dynamic elements. Data retrieval remained a manual, "on-demand" task.
- The AI and Automation Integration (2020s): The current era is defined by the integration of Artificial Intelligence to interpret data and automation to distribute it. The Scheduled Export feature represents the maturity of this era, where the tool not only collects data but also manages the logistics of its dissemination.
Strategic Implications for Agencies and In-House Teams
The implications of this update are particularly profound for digital marketing agencies. Agencies managing dozens of clients often spend hundreds of hours per year simply logging into accounts to grab screenshots for monthly reports. By scheduling these exports to go directly to account managers or even directly to the client, agencies can significantly reduce billable hours spent on administrative tasks, allowing them to focus more on strategy and execution.
For in-house teams, the benefit lies in the reduction of "data silos." When data is buried behind a login, it is often ignored by those who do not use the tool daily. By pushing a Heatmap image into a Slack channel or a shared inbox, the visibility of user behavior increases across the organization. A developer might notice a technical glitch on a mobile device by seeing a cluster of "rage clicks" in a scheduled heatmap image that they otherwise would never have looked for.
Inferred Industry Response and Market Context
While official statements from the development team emphasize user convenience, industry analysts suggest that this move is a response to the increasing demand for "interoperable data." In a market where Microsoft Clarity, Hotjar, and FullStory are competing for market share, the ease with which data can be extracted and utilized becomes a key differentiator.
Experts in the CRO field have noted that the "barrier to entry" for data analysis is often psychological. "When you make data arrive in the inbox, you remove the hurdle of the login," says one industry consultant. "It changes the relationship with the data from a chore to a briefing." The inclusion of JSON also suggests that the platform is positioning itself as a data provider for the broader "MarTech" stack, rather than just a standalone visualization tool.
Analysis of Broader Impacts on Data-Driven Culture
The move toward automated reporting reflects a broader trend in software-as-a-service (SaaS) known as "headless" or "invisible" software. This is the idea that the most valuable tools are the ones that work in the background without requiring the user to constantly interact with a dashboard. By automating the export of Heatmap data, the platform becomes an integrated part of the user’s workflow rather than a separate destination.
Furthermore, the environmental and operational efficiency of this update cannot be overlooked. By automating the rendering and delivery process server-side, the platform can optimize its own resource usage, potentially reducing the load caused by thousands of users manually triggering exports simultaneously during peak business hours.
Conclusion and Future Outlook
The launch of Scheduled Exports for Heatmaps marks a significant advancement in the usability of behavioral analytics. By providing a reliable, automated pipeline for images, CSVs, and JSON data, the platform has addressed the needs of a diverse user base ranging from creative designers to technical developers. As organizations continue to move toward more agile, data-centric models, the ability to automate the delivery of insights will likely become a standard expectation for all analytics platforms.
Looking ahead, the logical progression of this feature would be the integration of "Conditional Scheduling"—the ability to receive an export only when certain data thresholds are met, such as a significant drop in engagement or a spike in clicks on a specific element. For now, however, the ability to schedule regular reports is a substantial leap forward in helping businesses stay connected to their users’ behavior with minimal effort and maximum clarity. This update ensures that the story told by user data is never missed, simply because someone forgot to log in and check.


 Nana Muazin