In the rapidly evolving digital landscape of 2026, the strategic importance of social media metrics has never been more pronounced. These data points serve as critical indicators, measuring the efficacy of a brand’s social media strategy across diverse platforms. They provide insights into how audiences discover, interact with, and ultimately act upon content, encompassing both organic and paid activities. Understanding these metrics is fundamental for businesses aiming to refine their content, optimize advertising expenditure, and solidify their overall digital strategy.
The Evolving Landscape of Social Media Measurement
Social media metrics are often conflated with Key Performance Indicators (KPIs), yet a crucial distinction exists. Metrics quantify specific occurrences—for instance, impressions or likes—while KPIs are strategic metrics directly linked to overarching business objectives. An impression is a metric; a goal to "increase qualified leads from Instagram by 15% this quarter" is a KPI. Every KPI is built upon a foundation of metrics, but not all metrics rise to the level of a KPI. This differentiation is vital for moving beyond superficial "vanity metrics" to truly impactful performance analysis.

The contemporary social media environment, particularly in 2026, necessitates a robust measurement framework. With revenue growth consistently identified as a top priority for Chief Marketing Officers (CMOs), according to Gartner’s 2025-2026 reports, strategic social media planning demands consistent measurement to guide decisions and unequivocally demonstrate impact. The widely adopted "70/20/10 rule" for content planning—70% value-driven posts, 20% shared external content, and 10% promotional material—illustrates how content strategy inherently dictates measurement priorities. Value-driven content typically emphasizes engagement and reach, while promotional efforts lean heavily on conversion and paid metrics.
Strategic Alignment: Matching Metrics to Business Objectives
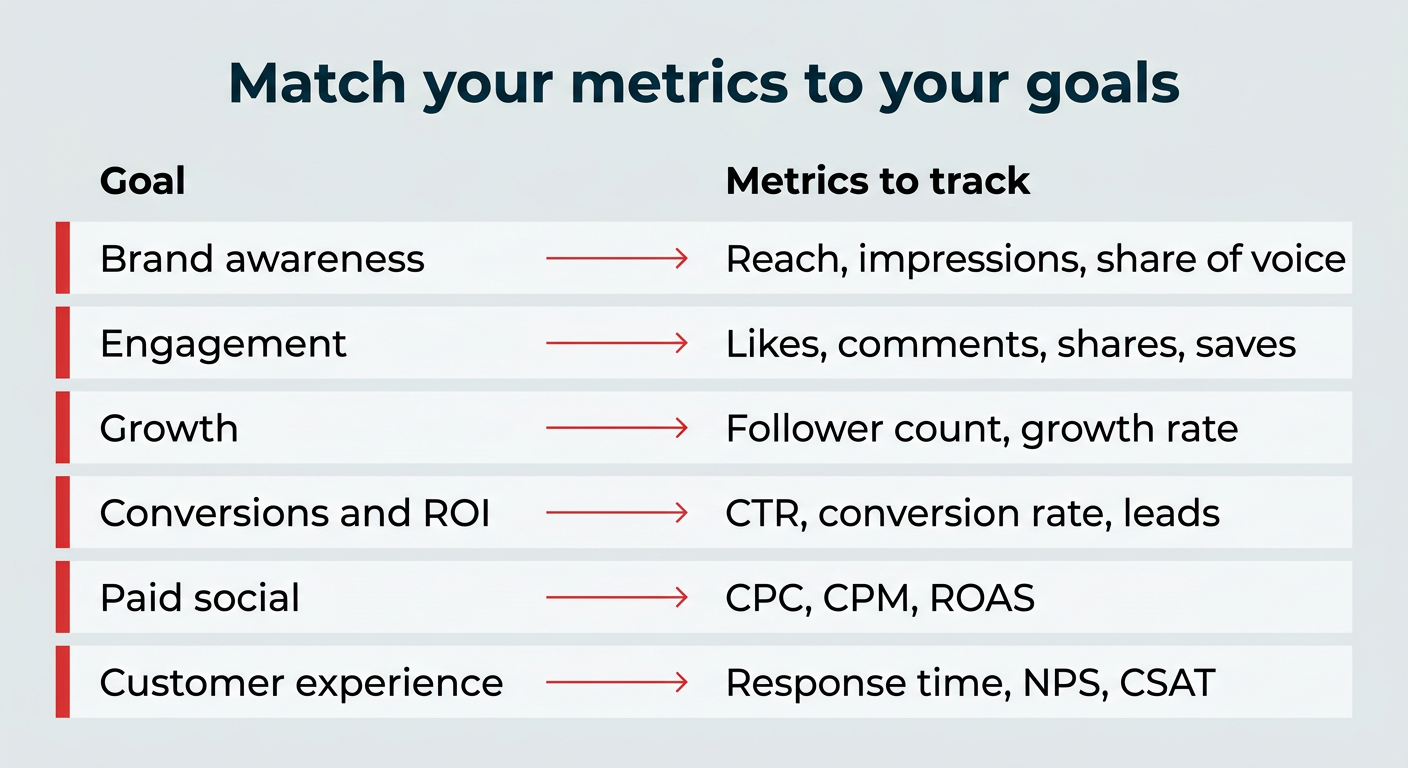
Effective social media measurement begins with clearly defined goals. Rather than indiscriminately tracking every available data point, enterprises must narrow their focus to metrics that directly demonstrate progress toward primary objectives. This goal-centric approach ensures that data collection and analysis remain purposeful and actionable.
A comprehensive framework for aligning goals with relevant metrics includes:

- Brand Awareness: Metrics such as reach, impressions, and social share of voice (SSoV) are paramount. These quantify the visibility and mindshare a brand achieves within its target audience and competitive landscape.
- Engagement: Likes, comments, shares, saves, and engagement rate indicate how deeply content resonates with an audience, fostering interaction and community.
- Growth: Follower count and follower growth rate are essential for monitoring audience expansion and brand influence.
- Conversions and ROI: Click-through rate (CTR), conversion rate, sign-ups, downloads, and leads directly measure the effectiveness of social media in driving desired business actions.
- Paid Social Performance: Cost per click (CPC), cost per thousand impressions (CPM), and return on ad spend (ROAS) are critical for evaluating the efficiency and profitability of paid campaigns. Notably, paid campaigns now constitute nearly 32% of U.S. digital ad spending in 2025, underscoring the necessity of these metrics (eMarketer).
- Customer Experience: Average response time, Net Promoter Score (NPS), Customer Satisfaction (CSAT), and sentiment analysis reflect the quality of customer interaction and support via social channels.
Before reporting, it is crucial for all team members to agree on shared definitions for each metric. This standardization ensures consistency in interpretation and avoids miscommunication or erroneous conclusions.
Navigating Platform Nuances: Definitions and Discrepancies
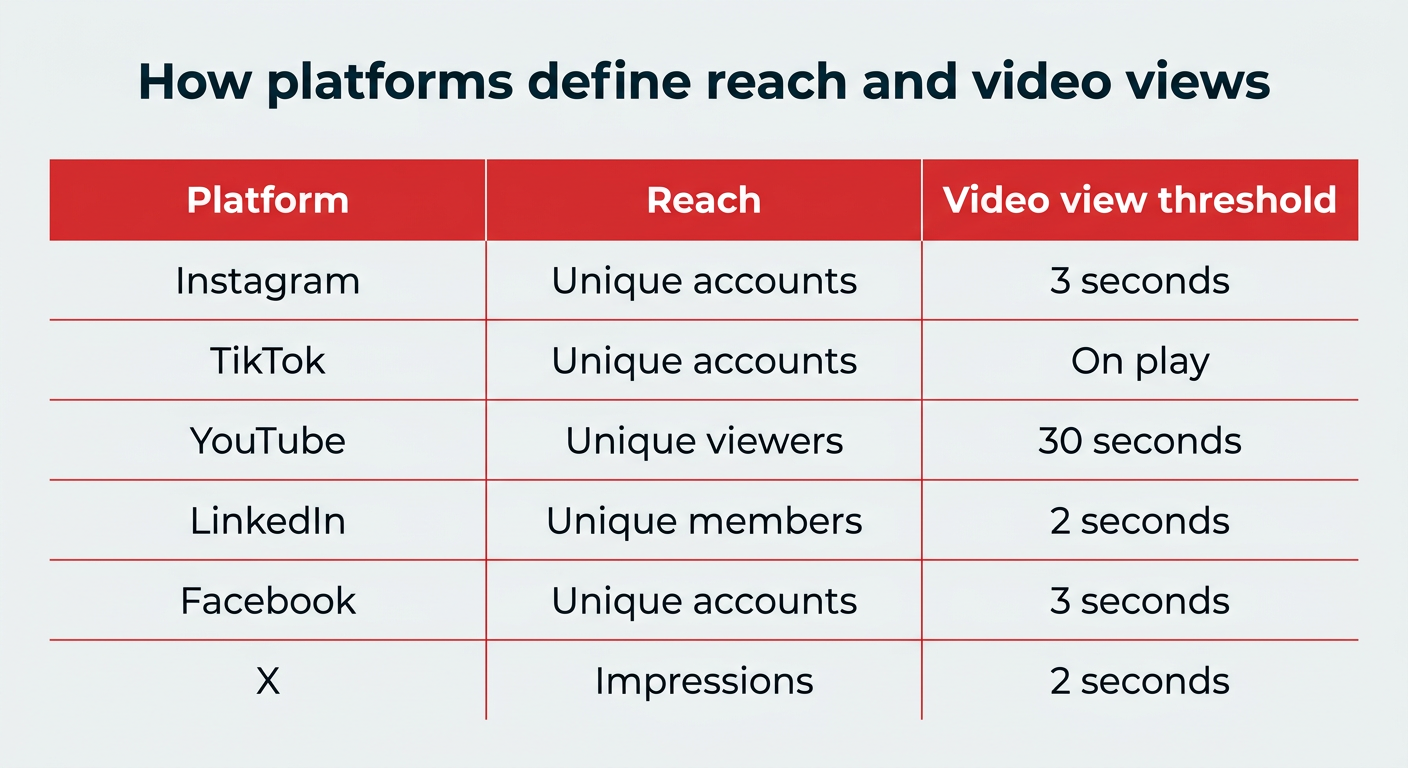
A significant challenge in multi-platform social media analysis stems from the varying definitions of identical metric names across different platforms. A "view" on YouTube, for instance, is not equivalent to a "view" on TikTok, and "reach" is calculated differently on Instagram compared to LinkedIn. Failing to account for these discrepancies can lead to inaccurate comparisons and flawed strategic decisions.
Key definitional differences include:
- Reach: Instagram, TikTok, and Facebook define reach as unique accounts that viewed content. LinkedIn refers to unique members, while X (formerly Twitter) primarily reports impressions rather than unique reach.
- Video View Thresholds: TikTok counts a view as soon as the video begins playing. Instagram and Facebook require at least 3 seconds. LinkedIn and X stipulate at least 2 seconds with 50% of the video in view, while YouTube sets the bar at 30 seconds.
Similarly, engagement rate calculations can vary, with some platforms or tools measuring it against total followers, and others against reach or impressions. This often explains why the same post might display different engagement rates across different analytics tools. Consequently, confirming a platform’s specific metric definition is an indispensable step before benchmarking or reporting.
Key Categories of Social Media Metrics for 2026
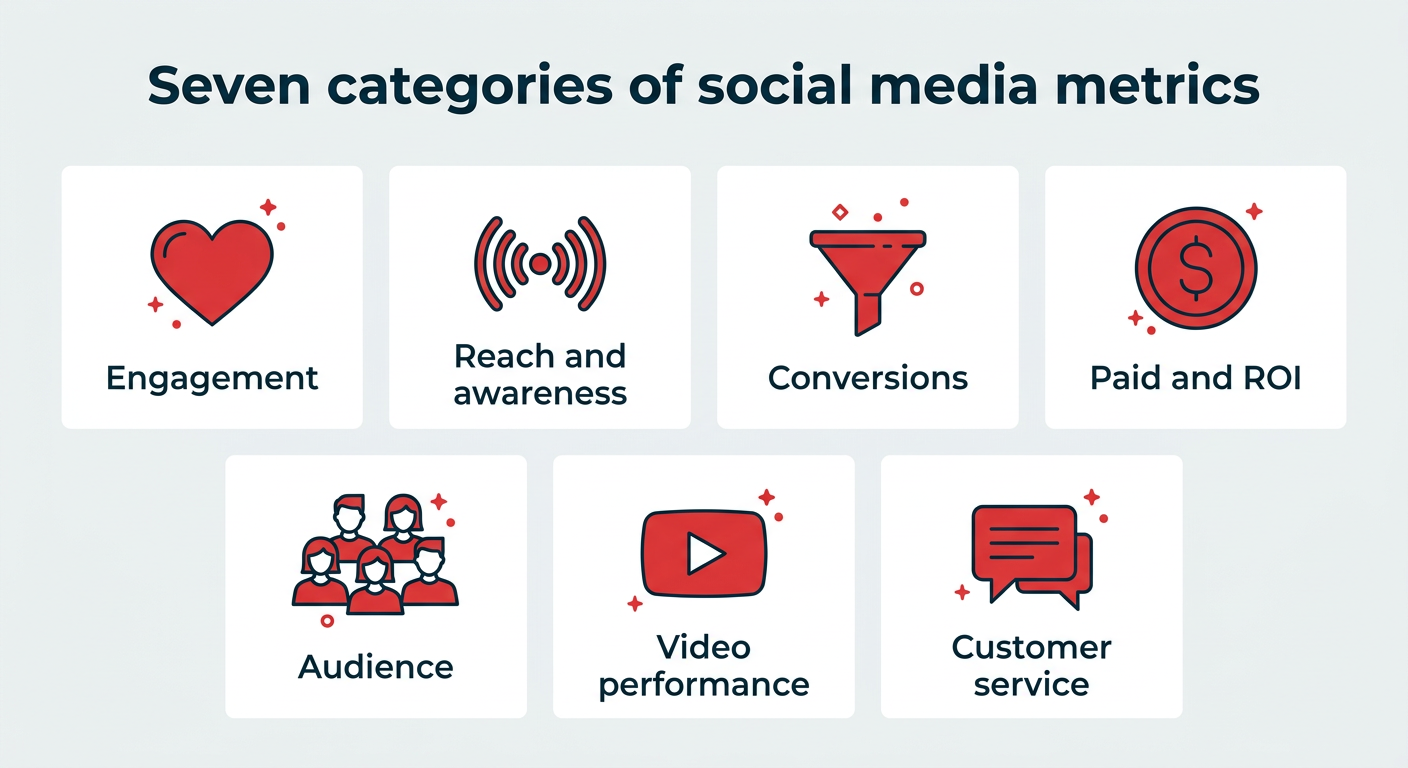
A comprehensive understanding of 25 essential social media metrics is critical for navigating the complexities of digital marketing in 2026. These are broadly categorized to facilitate focused analysis.
I. Engagement Metrics
Engagement metrics reveal the degree to which an audience interacts with content, indicating its resonance. High engagement is a strong signal of content quality and often positively influences social media algorithms, extending content reach.
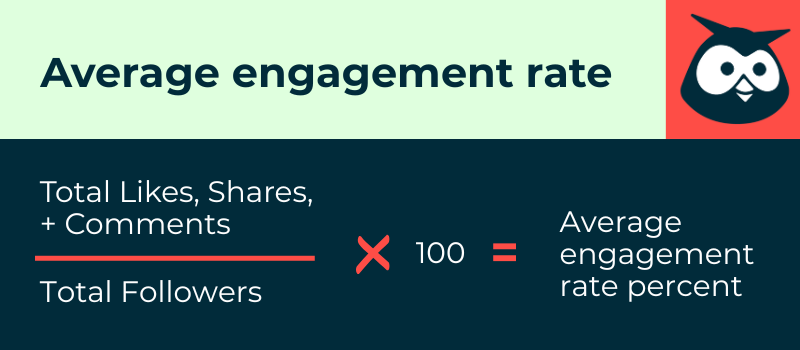
- Engagement Rate: This metric quantifies content resonance relative to audience size, serving as a reliable indicator of genuine connection.
- Formula: (Total likes + comments + shares + saves) ÷ total followers × 100.
- Strategic Value: Benchmarking against industry and platform averages (e.g., Instagram’s average 3.5% engagement rate) provides critical context.
- Likes and Reactions: These indicate momentary interaction. While sometimes dismissed as "vanity metrics," they offer a quick gauge of initial content appeal. On platforms like Facebook and LinkedIn, specific reactions (love, laughter, anger) provide lightweight sentiment signals.
- Strategic Value: Tracking trends over time helps identify content formats or themes that consistently capture audience attention.
- Comments: Comments represent a higher level of engagement, signifying that content has provoked thought or inquiry.
- Strategic Value: Comment sections are invaluable sources of direct audience feedback, revealing ideas, objections, and insights. Monitoring comment volume over time indicates growing audience investment.
- Shares: The number of times content is distributed by users to their networks.
- Strategic Value: Shares are a strong endorsement, indicating that content is perceived as valuable, informative, or agreeable, as highlighted by Hootsuite’s Consumer Report. Consistent tracking reveals content types that inspire advocacy.
- Saves and Save Rate: The number of times users bookmark content for future reference.
- Formula: (Total saves ÷ reach) × 100.
- Strategic Value: Saves represent high-intent engagement, indicating genuine utility (e.g., tutorials, tips). Instagram’s algorithm, in particular, heavily favors high save rates, making this a powerful signal for content strategy.
II. Reach and Awareness Metrics
These metrics quantify content visibility and overall brand attention on social platforms, indicating the size and expansion of the online audience.
- Reach: The number of unique individuals who have seen content.
- Strategic Value: Tracking average and per-post reach helps assess audience penetration. Analyzing the proportion of followers vs. non-followers reached indicates algorithmic favor or shareability.
- Impressions: The total number of times content appeared on screens, including multiple views by the same user.
- Strategic Value: Impressions provide insight into frequency and visibility. A high impression-to-reach ratio suggests content stickiness, warranting further investigation into its appeal.
- Social Share of Voice (SSoV): Measures a brand’s presence in social conversations relative to competitors.
- Formula: (Brand mentions ÷ total industry mentions) × 100.
- Strategic Value: SSoV serves as a competitive analysis tool, indicating a brand’s relevance and visibility within its market. Monitoring tools can automate this complex calculation.
- Social Search Visibility: How often a brand or its content appears in search results within social platforms (e.g., TikTok Search, Instagram Search).
- Strategic Value: This metric is increasingly critical, especially given that Gen Z frequently initiates searches on platforms like TikTok and Instagram rather than traditional search engines (Statista). Tracking keyword rankings within these platforms is becoming a standard component of social measurement.
III. Conversion Metrics
Conversion metrics gauge the effectiveness of social media efforts in driving desired actions, such as clicks, sign-ups, or purchases, across both organic and paid content.
- Conversion Rate: The frequency with which social content leads to a specific conversion (e.g., sign-up, download, sale).
- Formula: (Number of conversions ÷ number of clicks) × 100.
- Strategic Value: This is a cornerstone metric for demonstrating the tangible value of social media campaigns. In 2026, with the deprecation of third-party cookies and tighter privacy regulations, accurate attribution has become more challenging. UTM parameters are essential for bridging this gap, allowing marketers to precisely track which social posts and campaigns drive specific actions.
- Click-Through Rate (CTR): The percentage of people who click a link or call-to-action within a post.
- Formula: (Total clicks ÷ total impressions) × 100.
- Strategic Value: CTR indicates content’s ability to prompt further exploration, providing insights into the efficacy of different content types in promoting brand assets. Most platforms natively report CTR, simplifying tracking.
IV. Paid Social and ROI Metrics
These metrics evaluate the efficiency and return on investment (ROI) of paid social campaigns, crucial for justifying ad spend and demonstrating financial impact to leadership.
- Cost Per Click (CPC): The amount paid for each individual click on a social ad.
- Formula: (Total ad spend ÷ total number of clicks).
- Strategic Value: Contextualizing CPC with customer lifetime value (CLTV) or average order value (AOV) helps determine affordable spending limits. A higher CLTV combined with a strong conversion rate can justify a higher CPC.
- Cost Per Thousand Impressions (CPM): The cost incurred for every thousand impressions of a social media ad.
- Formula: (Total ad spend ÷ total impressions) × 1,000.
- Strategic Value: CPM is purely a measure of view-based efficiency, particularly relevant for brand awareness campaigns where the primary goal is broad visibility rather than immediate action.
- Return On Ad Spend (ROAS): The revenue generated for every dollar spent on social ads.
- Formula: (Revenue from ads ÷ ad spend) × 100.
- Strategic Value: ROAS directly addresses the profitability of ad campaigns, answering the critical question of whether ad spend is generating financial returns. Most ad platforms provide native ROAS reporting when conversion tracking is correctly configured. Pairing ROAS with conversion rate ensures that high-performing ads are not only generating clicks but also driving desired business outcomes.
V. Audience Metrics
Audience metrics characterize followers, track growth, and assess brand perception, enabling refined messaging and targeted growth strategies.
- Follower Count: The total number of followers on each platform.
- Strategic Value: While often considered a "vanity metric," Hootsuite’s Consumer Report indicates that a significant majority of followers have explicit plans to purchase from a brand. Thus, follower count remains a quick indicator of overall social media effort efficacy.
- Follower Growth Rate: Measures the percentage increase in new followers over a specified period.
- Formula: (Net new followers over reporting period ÷ total audience) × 100.
- Strategic Value: This metric provides a more nuanced view of audience expansion than raw follower count, accounting for the existing audience base.
- Social Media Sentiment: Analysis of audience emotion (positive, negative, neutral) when discussing a brand online.
- Strategic Value: Beyond basic engagement, sentiment analysis provides deep qualitative insights into brand perception. Specialized tools are necessary to process and categorize language effectively.
- Demographics: Data describing followers, including age, gender identity, location, and online activity patterns.
- Strategic Value: In 2026, platforms offer advanced psychographic and behavioral data (interests, purchase behavior, job titles, content preferences). These insights are invaluable for tailoring content, optimizing posting times, and directing marketing messages.
VI. Video Performance Metrics
These metrics track how audiences consume and interact with video content across social platforms.
- View Count: The number of times a video has been watched, subject to platform-specific minimum watch-time thresholds.
- Strategic Value: A basic indicator of initial audience interest, showing how many people paused to give the video a chance.
- Video Completion Rate: The percentage of viewers who watch a video to its conclusion.
- Formula: (Number of completed views ÷ total video views) × 100.
- Strategic Value: Completion rate is a superior indicator of sustained audience attention and content resonance than view count alone. High completion rates are often favored by social media algorithms.
- Watch Time: The cumulative duration viewers spend watching video content.
- Strategic Value: Watch time is a powerful signal of genuine interest, revealing whether content holds attention or if viewers drop off prematurely. Tracking average watch time alongside total watch time provides actionable insights into content structure and pacing.
VII. Customer Service Metrics
These metrics evaluate the efficiency and quality of customer support delivered via social channels.
- Average Response Time: The duration taken by a customer service team to respond to queries received via social channels.
- Formula: (Total time for initial response to customer queries ÷ number of queries).
- Strategic Value: Timely responses are crucial for customer satisfaction and brand reputation. AI customer service bots can significantly reduce response times for common inquiries.
- Customer Satisfaction (CSAT) Score: Measures immediate customer happiness with a product, service, or specific interaction (e.g., social customer service).
- Formula: (Number of satisfied customers ÷ total number of responses) × 100.
- Strategic Value: CSAT provides direct feedback on the quality of social support interactions, often collected via single-question surveys post-interaction.
- Net Promoter Score (NPS): A metric for gauging customer loyalty and likelihood to recommend a brand.
- Formula: (Percentage of promoters – percentage of detractors).
- Strategic Value: Unlike CSAT, NPS is forward-looking, predicting future customer relationships and potential for organic advocacy. It categorizes customers into Promoters (9-10), Passives (7-8), and Detractors (0-6).
- Referral Traffic from Social: The number of website visitors originating from social media links.
- Strategic Value: This "bridge metric" directly connects social activity to website-level business outcomes. Google Analytics, combined with UTM parameters on tracked social links, allows for precise identification of which platforms, campaigns, and posts drive valuable website visits.
Operationalizing Insights: Turning Data into Strategy
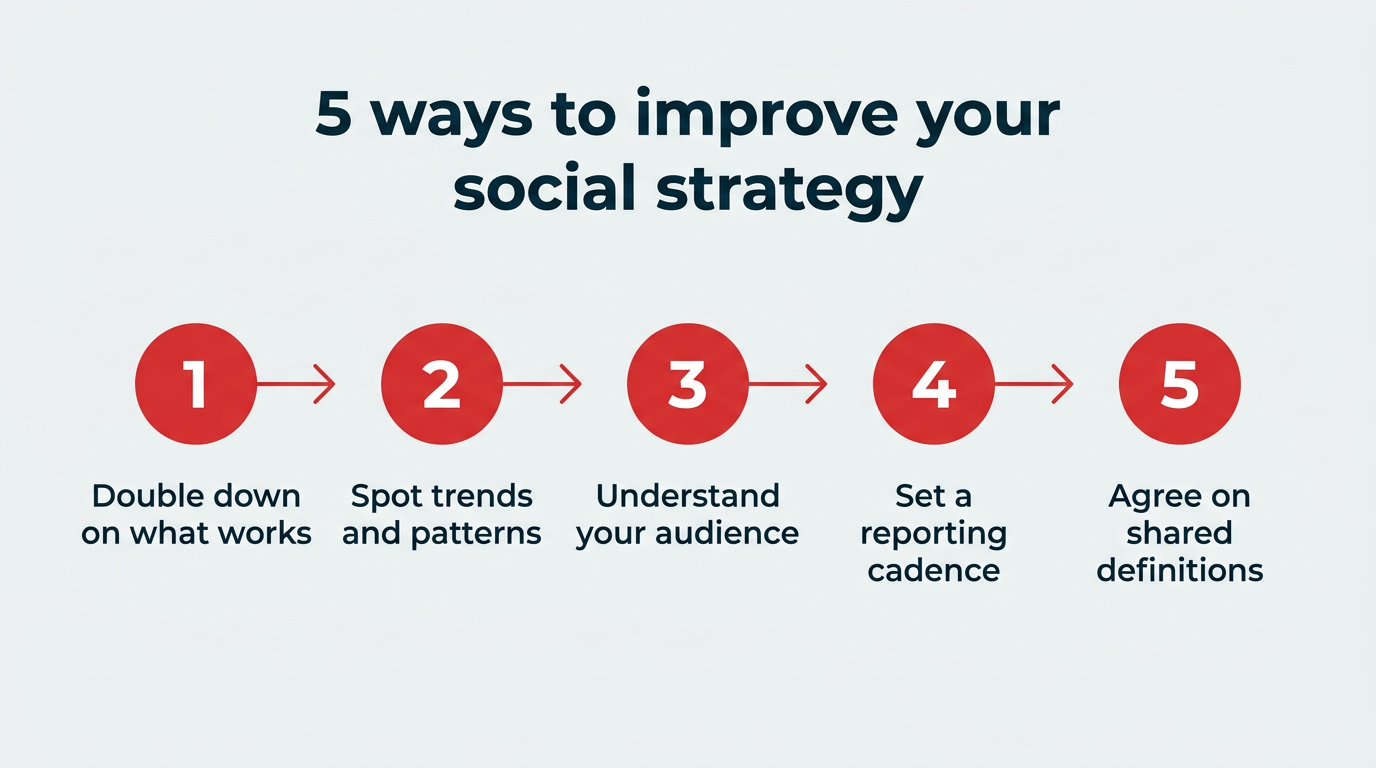
The true value of social media metrics lies in their conversion into actionable strategic adjustments. The process is iterative and involves several key steps:
- Define Clear Goals: Establish precise, measurable objectives for social media efforts.
- Select Relevant Metrics: Choose metrics that directly align with and effectively track progress toward these goals.
- Establish Benchmarks: Compare current performance against historical data, industry averages, and competitor performance to contextualize results.
- Analyze Trends and Patterns: Identify recurring successes, areas for improvement, and emerging opportunities.
- Iterate and Optimize: Based on analysis, adjust content strategy, targeting, posting schedules, and campaign budgets. This iterative feedback loop, ideally structured with a robust social media strategy template, ensures continuous improvement and compounding results.
Tracking the right metrics is indispensable for accelerating brand presence, enhancing social media ROI, and transforming daily data into sustained long-term success.

Tools for Comprehensive Social Media Measurement
Organizing and managing the multitude of social media metrics requires efficient tools.
- Native Platform Analytics: All major social platforms (Facebook, Instagram, LinkedIn, TikTok, X, YouTube, Pinterest) offer free, built-in analytics dashboards. These are excellent starting points for accessing core metrics directly from the source. However, manually consolidating data from multiple platforms can become cumbersome for larger operations.
- Social Media Report Templates: For spreadsheet-proficient users, custom templates allow for manual data entry and automated formula calculations. These typically include sections for follower growth, engagement rates, top-performing content, and conversion data. Pre-built templates can provide a significant head start.
- Integrated Social Media Management Platforms (e.g., Hootsuite, Perch by Hootsuite): These platforms consolidate analytics from multiple social accounts into a single dashboard, simplifying tracking and reporting. They often include features for setting up custom dashboards, calculating metrics automatically, and generating digestible reports. Perch by Hootsuite, for example, is designed to track metrics and compile them into accessible reports.
- Consumer Intelligence Platforms (e.g., Lumen by Talkwalker): Integrated with social media management tools, platforms like Lumen provide advanced social listening capabilities. They enable monitoring of brand mentions, sentiment, keywords, and hashtags across a wide array of online platforms and publications, offering deep insights into audience perception.
- Meta Business Suite: For businesses with a presence exclusively on Facebook and Instagram, Meta Business Suite offers a free, unified dashboard for managing analytics, messages, and content across both platforms. It serves as a robust free option for smaller entities before investing in third-party software.
By leveraging these tools and adopting a strategic, goal-oriented approach to social media measurement, businesses can navigate the dynamic digital landscape of 2026 with clarity, precision, and demonstrable impact.