The global mobile application market, currently valued at over $500 billion, has reached a point of saturation where the mere existence of a functional app is no longer a guarantee of commercial success. As developers and product managers navigate an increasingly competitive landscape, the methodologies used to measure performance have come under intense scrutiny. While traditional quantitative analytics have long served as the industry standard, providing a numerical overview of user behavior, a growing consensus among industry experts suggests that these metrics alone are insufficient. The emergence of qualitative analytics—specifically touch heatmaps and user session recordings—is now being recognized as the critical missing link in the app optimization workflow, offering a comprehensive understanding of the "why" behind the "what" of user behavior.
The Context of Modern App Performance Metrics
To understand the current shift in analytics, one must look at the historical trajectory of the mobile app industry. In the early 2010s, success was measured primarily through "vanity metrics" such as total downloads and app store rankings. However, as the market matured, the focus shifted toward retention and engagement. Industry data from organizations like Statista and Localytics indicates that approximately 25% of mobile applications are accessed only once after being downloaded. Furthermore, the average mobile app loses roughly 77% of its daily active users (DAUs) within the first three days of installation.
These staggering abandonment rates highlighted a significant flaw in the standard analytical workflow. Quantitative tools, such as Google Analytics for Firebase or Mixpanel, provide excellent data on conversion funnels, bounce rates, and session lengths. They can alert a developer that a user dropped off at the "Sign Up" screen, but they cannot visually demonstrate that the user was frustrated by a non-responsive "Submit" button or a keyboard that obscured the text entry field. This gap between data notification and behavioral understanding is where qualitative analytics has found its foothold.
Technical Foundations: Heatmaps and Session Recordings
The integration of qualitative data into the professional workflow relies on two primary technological pillars: touch heatmaps and user session recordings. These tools do not replace traditional metrics but rather provide a layer of visual context that transforms abstract numbers into actionable insights.
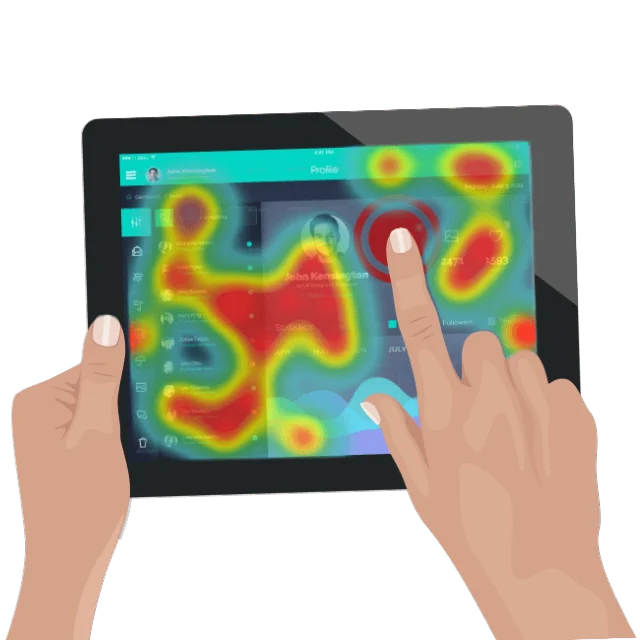
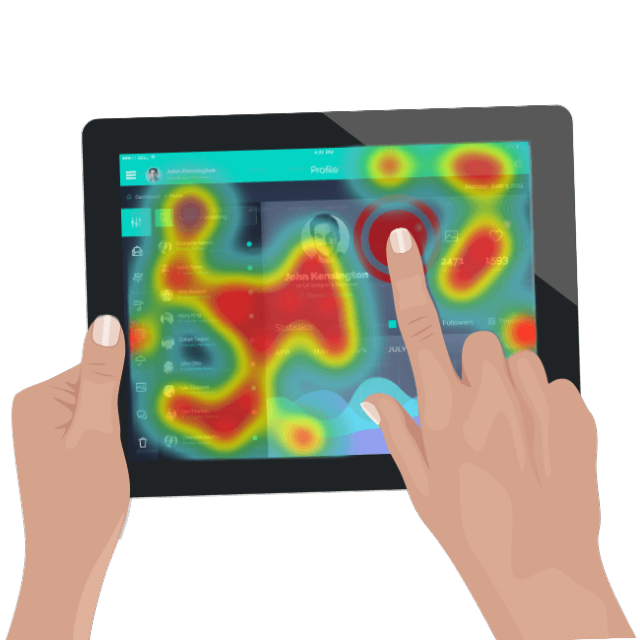
Touch heatmaps function by aggregating every physical interaction a user has with the device screen. By layering this data over the app’s user interface (UI), developers can identify "hot zones" where interaction is frequent and "cold zones" that are being ignored. More importantly, heatmaps reveal "unresponsive gestures"—instances where a user taps an element they believe to be interactive, but the app provides no feedback. These moments are identified by UX researchers as primary drivers of "user rage," a psychological state that leads to immediate app deletion.
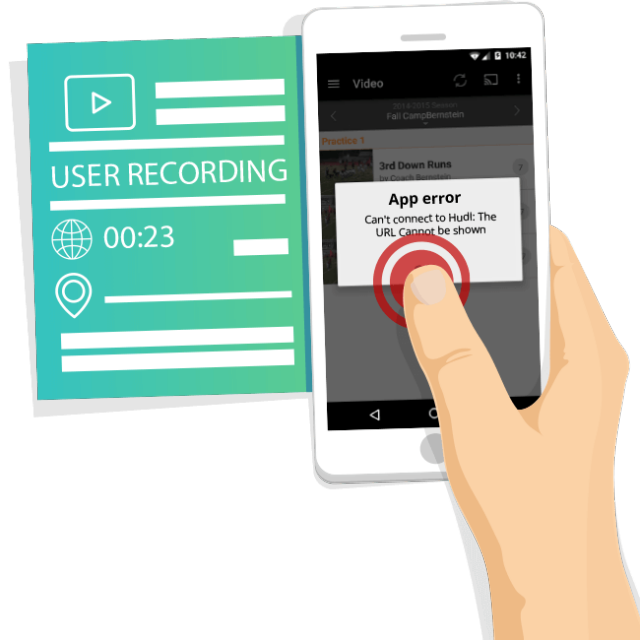
User session recordings take this a step further by providing a real-time, video-like playback of an individual user’s journey through the app. Unlike traditional usability testing, which often takes place in a controlled laboratory setting, session recordings capture behavior "in the wild." This allows app professionals to witness the sequence of events leading up to a crash or a conversion. Modern qualitative tools are designed to operate in the background with minimal impact on device CPU or battery life, ensuring that the recorded behavior remains organic and unbiased.
Chronology of an Analytical Shift
The transition toward a dual-analytics approach has followed a logical progression over the last decade:
- The Quantitative Era (2008–2014): Focus on acquisition, downloads, and basic crash reporting. Analytics were used primarily to justify marketing spend.
- The Funnel Optimization Era (2015–2018): Developers began focusing on the "leaky bucket" problem. Tools became more sophisticated at tracking specific events and user paths, identifying exactly where users were leaving.
- The Behavioral/Qualitative Era (2019–Present): With the cost of user acquisition (CAC) skyrocketing, the focus has shifted entirely to retention. Understanding the nuances of the user experience (UX) became the primary competitive advantage, leading to the widespread adoption of qualitative tools.
Supporting Data and Economic Implications
The economic argument for qualitative analytics is rooted in the rising costs of the app economy. According to recent industry reports, the average cost to acquire a loyal user can exceed $5.00 in certain competitive categories like Finance or Gaming. When a user abandons an app due to a preventable UI friction point, the developer is not just losing a user; they are losing the capital invested in that acquisition.
Data suggests that proactive troubleshooting through qualitative analysis can reduce churn rates by as much as 15% to 20%. By identifying a single broken link or an unintuitive navigation flow through a session recording, a product team can salvage thousands of dollars in potential lifetime value (LTV). Furthermore, the "Alert-Investigate-Resolve" workflow enabled by combined analytics significantly reduces the "Mean Time to Repair" (MTTR) for critical bugs, which is a key performance indicator for DevOps and engineering teams.
Industry Perspectives and Expert Analysis
Market analysts suggest that the "blind spot" in quantitative data is often responsible for the failure of otherwise well-funded projects. "Numbers tell you the score of the game, but they don’t show you the game film," says one senior product strategist. "If you see that users are failing to complete a purchase, you can guess that the price is too high, or you can watch the recording and see that the ‘Purchase’ button is actually being cut off on certain screen resolutions. One is a guess; the other is a fix."
This sentiment is echoed across the software development lifecycle. In traditional workflows, a QA (Quality Assurance) team might struggle to replicate a bug reported by a user in a vague support ticket. With qualitative analytics, the support ticket comes attached to a recording of the exact session where the error occurred. This transparency eliminates the friction between customer support and engineering teams, leading to faster development cycles.
Strategic Workflows: Optimization and Troubleshooting
The implementation of qualitative analytics typically manifests in two revamped professional workflows: Data-Fueled Optimization and Proactive Troubleshooting.
Data-Fueled Optimization
In this workflow, quantitative data acts as the "alarm system." For instance, if an e-commerce app sees a 40% drop-off at the shipping information page, the quantitative data has successfully identified the location of the problem. The team then switches to qualitative tools, watching recordings of users on that specific page. They might discover that users are confused by a specific form field or that a "Calculate Shipping" button is unresponsive. The fix—shortening the form or fixing the button—is data-driven and precise.
Proactive Troubleshooting
Unlike traditional methods that react to a spike in crash rates, proactive troubleshooting involves the regular review of heatmaps and session recordings to spot "friction" before it becomes a "failure." This includes identifying "near-misses"—situations where a user eventually completed a task but struggled significantly to do so. By smoothing out these minor hurdles, developers can improve the overall "feel" of the app, which is often the intangible difference between a 3-star and a 5-star rating.
Broader Impact and Future Implications
As the mobile landscape continues to evolve, the integration of qualitative data is expected to become even more automated. Artificial intelligence and machine learning are already being used to scan thousands of hours of session recordings to automatically flag "frustrated behavior," such as rapid repetitive tapping or "mouse thrashing" (in the case of web-mobile hybrids).
However, this increase in data collection also brings significant responsibilities regarding user privacy. The industry is currently navigating the complexities of regulations like the General Data Protection Regulation (GDPR) and the California Consumer Privacy Act (CCPA). Leading qualitative analytics providers have responded by implementing robust data masking features, which automatically redact sensitive information—such as passwords or credit card numbers—from recordings before they are even uploaded to the server.
Conclusion
The shift toward a holistic analytical approach represents a maturing of the mobile app industry. By moving beyond the "what" of quantitative metrics and embracing the "why" of qualitative insights, app professionals are better equipped to meet the high expectations of modern users. In an era where user experience is the ultimate differentiator, the ability to see the app through the eyes of the user is no longer a luxury—it is a fundamental requirement for survival and growth in the digital marketplace. The "fresh twist" of qualitative analytics is, in reality, a return to the fundamentals of good design: observing the human element within the digital machine.