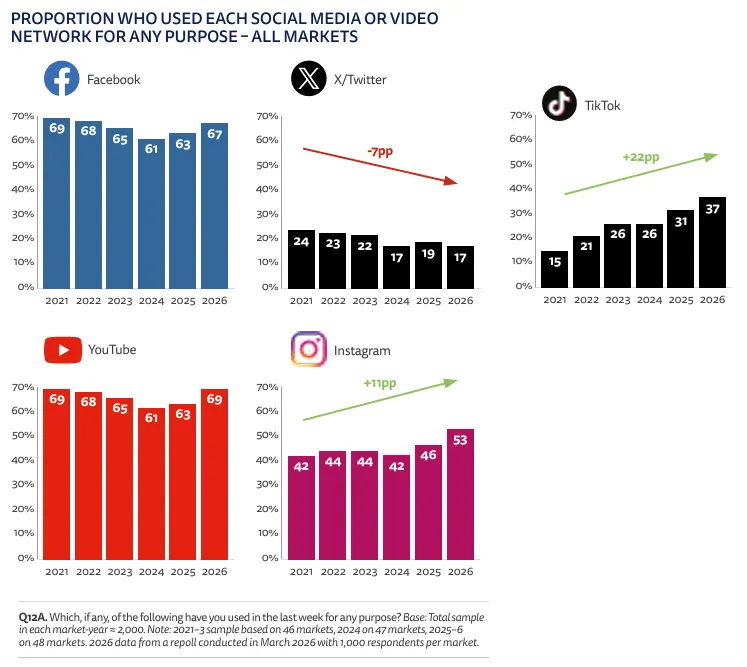
In the dynamic landscape of digital marketing, social media engagement rates serve as critical performance indicators, offering businesses invaluable insights into the effectiveness of their online strategies. Without robust social media benchmarks, raw data can be meaningless, making it challenging for brands to gauge their true standing in a competitive marketplace. A recent comprehensive analysis compiled by Hootsuite, drawing on data from 12 leading industries, provides a crucial framework for evaluating social media performance, highlighting significant variations across platforms and sectors. This report underscores the necessity for companies to compare their own results against industry averages to refine their content strategies and optimize digital outreach.
The Indispensable Role of Social Media Benchmarks
![Average engagement rates for 12 industries [2026 update]](https://blog.hootsuite.com/wp-content/uploads/2024/09/Average-engagement-rate-media-benchmarks-Q4-2024-data-tips-time-to-post-on-social-media-Q3-2024-data.png)
Social media benchmarks are more than just numbers; they are the compass guiding brands through the complex digital terrain. They enable businesses to contextualize their performance, moving beyond mere follower counts to understand how actively their audience interacts with content. This deeper understanding is paramount for several reasons: it informs resource allocation, helps identify successful content formats, justifies marketing investments, and provides a clear roadmap for improvement. In an era where digital presence is synonymous with market relevance, knowing where one stands relative to peers is not just advantageous but essential for sustained growth and competitive advantage. The data compiled by Hootsuite for Q4 2024 and Q3 2024 offers a timely snapshot, revealing that engagement rates vary significantly by platform, with Instagram consistently leading and Facebook often trailing, while certain industries, such as construction, education, and nonprofits, demonstrate notably stronger performance.
Overall Engagement Landscape: A Platform-Specific Overview
![Average engagement rates for 12 industries [2026 update]](https://blog.hootsuite.com/wp-content/uploads/2024/09/Average-engagement-rate-media-benchmarks-Q4-2024-data-tips-time-to-post-on-social-media-Q3-2024-data-556x556.png)
The analysis reveals a distinct hierarchy among social media platforms in terms of average engagement per post. Instagram, with its strong visual emphasis and algorithm that prioritizes interaction, consistently emerges as the frontrunner, recording an impressive overall average engagement rate of approximately 3.5%. This platform’s success can be attributed to its diverse content formats, including photos, stories, and Reels, which foster high levels of user interaction through likes, comments, saves, and shares. For brands seeking to cultivate vibrant online communities and drive meaningful interactions, Instagram remains a potent channel.
Conversely, Facebook generally exhibits lower engagement rates across most industries, often hovering around 1.3%. This trend reflects the platform’s maturity, increased competition for news feed visibility, and a user base that has diversified its social media consumption habits. While still a massive platform in terms of active users, Facebook’s algorithm has evolved to prioritize personal connections, making it more challenging for brand content to organically capture significant attention without paid promotion.
![Average engagement rates for 12 industries [2026 update]](https://blog.hootsuite.com/wp-content/uploads/2022/12/Benchmarking-4-620x174.jpg)
TikTok, despite its meteoric rise in popularity and viral potential, presents a unique challenge for many industries, registering the lowest overall average engagement rate at approximately 1.5%. While individual viral campaigns can achieve astronomical reach, maintaining consistent high engagement for brand content across the board remains difficult. The platform’s fast-paced, trend-driven nature demands a highly adaptive and authentic content strategy, and many traditional brands struggle to effectively integrate into its distinct ecosystem, often resulting in rates below 1% for sectors like Marketing Agencies and Technology.
LinkedIn, on the other hand, carves out a niche for professional engagement. While its overall average rate might not match Instagram’s, it demonstrates particular strength in B2B contexts and for industries focused on thought leadership and professional networking. Its engagement often stems from informative, discussion-driven posts, making it a valuable platform for specific objectives.
![Average engagement rates for 12 industries [2026 update]](https://blog.hootsuite.com/wp-content/uploads/2023/01/Inpost-CTA-Planner.png)
Industry-Specific Insights: Diving Deeper into Performance
The Hootsuite report meticulously breaks down average engagement rates across 12 key industries, providing a granular view of performance benchmarks. These variations underscore the importance of sector-specific strategies, as what works for one industry may not translate effectively to another.
![Average engagement rates for 12 industries [2026 update]](https://blog.hootsuite.com/wp-content/uploads/2025/03/image-58-620x413.png)
High-Performing Sectors and Their Strategies:
- Construction, Mining, and Manufacturing: This sector surprisingly shows strong engagement, often driven by niche communities and a focus on industry news, project updates, and innovation. Average engagement rates here can reach around 3.0% on Instagram, 1.8% on LinkedIn, and 1.0% on Facebook, with TikTok presenting a greater challenge. The visual nature of large-scale projects and technical advancements often resonates well.
- Education: Educational institutions consistently achieve high engagement, particularly on platforms like Instagram (averaging 3.8%) and Facebook (around 1.5%). This is often fueled by student and alumni communities, visual content showcasing campus life, achievements, and informative updates. The inherent community aspect and shared identity contribute significantly to these higher rates.
- Nonprofits: Nonprofits are among the strongest performers, especially on Instagram, where they average around 3.9%, and notably lead in Instagram Reels engagement at 4.0%. Their mission-driven content naturally strikes an emotional chord, encouraging shares, comments, and support. Storytelling, impact reporting, and calls to action are highly effective strategies for this sector across all platforms.
Detailed Industry Benchmarks (Average Engagement Rates per Post):
![Average engagement rates for 12 industries [2026 update]](https://blog.hootsuite.com/wp-content/uploads/2025/03/image-59-620x413.png)
- Marketing Agencies:
- Instagram: ~2.8%
- Facebook: ~0.9%
- LinkedIn: ~2.5%
- TikTok: ~0.8%
- Analysis: Agencies face the unique challenge of marketing themselves while also managing client accounts. Their content often targets other businesses, making LinkedIn crucial. Lower TikTok rates suggest difficulty in consistently applying viral strategies to their own brand.
- Education:
- Instagram: ~3.8%
- Facebook: ~1.5%
- LinkedIn: ~2.9%
- TikTok: ~1.2%
- Analysis: High visual appeal of campus life, student achievements, and community-building initiatives drive strong engagement, especially on Instagram. LinkedIn is important for faculty and professional development.
- Media and Entertainment:
- Instagram: ~3.3%
- Facebook: ~1.2%
- LinkedIn: ~1.9%
- TikTok: ~2.0%
- Analysis: This industry thrives on dynamic, trending content. While Instagram remains strong, TikTok offers significant potential for viral clips and behind-the-scenes content, often outperforming other industries on this platform due to its content type.
- Financial Services:
- Instagram: ~2.0%
- Facebook: ~0.8%
- LinkedIn: ~3.2%
- TikTok: ~0.5%
- Analysis: A highly regulated industry, financial services often adopts a more cautious approach to social media. LinkedIn performs well due to its professional audience and focus on expert insights and market analysis. Visuals on Instagram need to be carefully crafted to build trust and educate.
- Dining, Hospitality, and Tourism:
- Instagram: ~3.7%
- Facebook: ~1.4%
- LinkedIn: ~2.1%
- TikTok: ~1.8%
- Analysis: This sector benefits immensely from visual storytelling, showcasing experiences, destinations, and culinary delights. Instagram and TikTok are natural fits for this content, driving aspirational engagement.
- Government:
- Instagram: ~2.2%
- Facebook: ~1.0%
- LinkedIn: ~2.7%
- TikTok: ~0.7%
- Analysis: Government agencies often use social media for public service announcements and community engagement. LinkedIn is effective for official communications and policy discussions, while Instagram can humanize public figures and initiatives.
- Healthcare, Pharma, and Biotech:
- Instagram: ~2.1%
- Facebook: ~0.9%
- LinkedIn: ~2.8%
- TikTok: ~0.6%
- Analysis: Similar to financial services, this sector navigates strict regulations and often focuses on education, trust-building, and professional insights. LinkedIn is a key platform for sharing research and industry developments.
- Real Estate, Legal, and Other Professional Services:
- Instagram: ~2.3%
- Facebook: ~1.1%
- LinkedIn: ~3.0%
- TikTok: ~0.7%
- Analysis: These industries rely on expertise and client relationships. LinkedIn is paramount for thought leadership and networking. Instagram can showcase lifestyle aspects (real estate) or team culture (legal).
- Consumer Goods & Retail:
- Instagram: ~3.6%
- Facebook: ~1.3%
- LinkedIn: ~3.9%
- TikTok: ~1.7%
- Analysis: This sector excels at showcasing products and building brand communities. Instagram is a natural fit for product visuals and lifestyle content. Notably, Consumer Goods & Retail demonstrates consistently high engagement on LinkedIn (3.9%), possibly due to informative posts about product development, sustainability, and corporate news, appealing to both consumers and industry professionals.
- Construction, Mining, and Manufacturing:
- Instagram: ~3.0%
- Facebook: ~1.0%
- LinkedIn: ~2.8%
- TikTok: ~0.6%
- Analysis: Visual updates on projects, safety initiatives, and industry innovation drive engagement. LinkedIn is strong for B2B communication and recruitment, while Instagram provides a platform for showcasing impressive work visually.
- Technology:
- Instagram: ~2.5%
- Facebook: ~1.0%
- LinkedIn: ~3.1%
- TikTok: ~0.9%
- Analysis: Tech companies often use social media to highlight innovation, product updates, and company culture. LinkedIn is vital for talent acquisition and industry influence. Achieving high TikTok engagement can be challenging without a strong, relatable brand persona.
- Utilities and Energy:
- Instagram: ~1.9%
- Facebook: ~0.8%
- LinkedIn: ~2.6%
- TikTok: ~0.4%
- Analysis: This sector often focuses on public service, infrastructure, and sustainability. LinkedIn serves as a platform for corporate responsibility and industry news. Engagement tends to be lower due to the nature of the service.
- Nonprofit:
- Instagram: ~3.9%
- Facebook: ~1.6%
- LinkedIn: ~3.0%
- TikTok: ~1.5%
- Analysis: The compelling stories and clear mission of nonprofits resonate deeply, driving strong emotional engagement and calls to action across platforms, particularly on Instagram.
- Overall Average:
- Instagram: ~3.5%
- Facebook: ~1.3%
- LinkedIn: ~2.8%
- TikTok: ~1.5%
- Analysis: These overall averages provide a general benchmark but highlight the significant variations that necessitate industry-specific comparisons.
Key Insights from Engagement Trends:
- Nonprofits Dominate Instagram Reels: The 4.0% engagement rate on Instagram Reels for nonprofits underscores the power of short-form video in conveying impactful messages. This format’s ability to tell compelling stories quickly and visually makes it ideal for capturing attention and fostering emotional connection, which aligns perfectly with nonprofit objectives.
- TikTok’s Persistent Challenge: Despite its widespread adoption, TikTok’s unique content demands mean that many industries, particularly those with more formal or technical offerings like Marketing Agencies and Technology, struggle to achieve average engagement rates above 1%. Brands must invest in understanding TikTok’s native content styles and trends rather than simply repurposing content from other platforms.
- LinkedIn as a B2B Powerhouse: The strong performance of sectors like Consumer Goods & Retail (3.9%), Financial Services (3.2%), and Technology (3.1%) on LinkedIn highlights its continued relevance for professional networking, industry insights, and B2B communication. Content that is informative, analytical, and fosters professional dialogue thrives on this platform.
Strategic Implications for Brands: Leveraging Benchmarks for Growth
![Average engagement rates for 12 industries [2026 update]](https://blog.hootsuite.com/wp-content/uploads/2025/03/image-60-620x413.png)
These benchmarks are not merely comparative figures; they are actionable intelligence. Brands can leverage this data to significantly enhance their social media strategies.
- Targeted Platform Investment: Understanding which platforms yield the highest engagement for their industry allows brands to allocate resources more effectively. If Instagram is a top performer, increased investment in visually rich content, Reels, and interactive Stories is warranted. For B2B companies, a robust LinkedIn strategy is critical.
- Content Optimization: Analyzing the types of content that drive high engagement within specific industry benchmarks can inform future content creation. If educational posts perform well in the healthcare sector, this indicates a need for more informative articles, infographics, and expert Q&As.
- Competitive Analysis: Benchmarks allow brands to identify direct competitors who are outperforming them and analyze their strategies. What are they doing differently? What content resonates with their shared audience?
- Goal Setting and Performance Measurement: Realistic and data-driven goals can be set using industry averages. A brand in financial services, for example, might aim for a LinkedIn engagement rate above 3.2%, knowing this is achievable and indicative of strong performance within their sector.
- Identifying Opportunities and Gaps: Low engagement on a particular platform for a specific industry could signal either an untapped opportunity (if the industry is generally underperforming there) or a need to re-evaluate the platform’s suitability for the brand’s objectives.
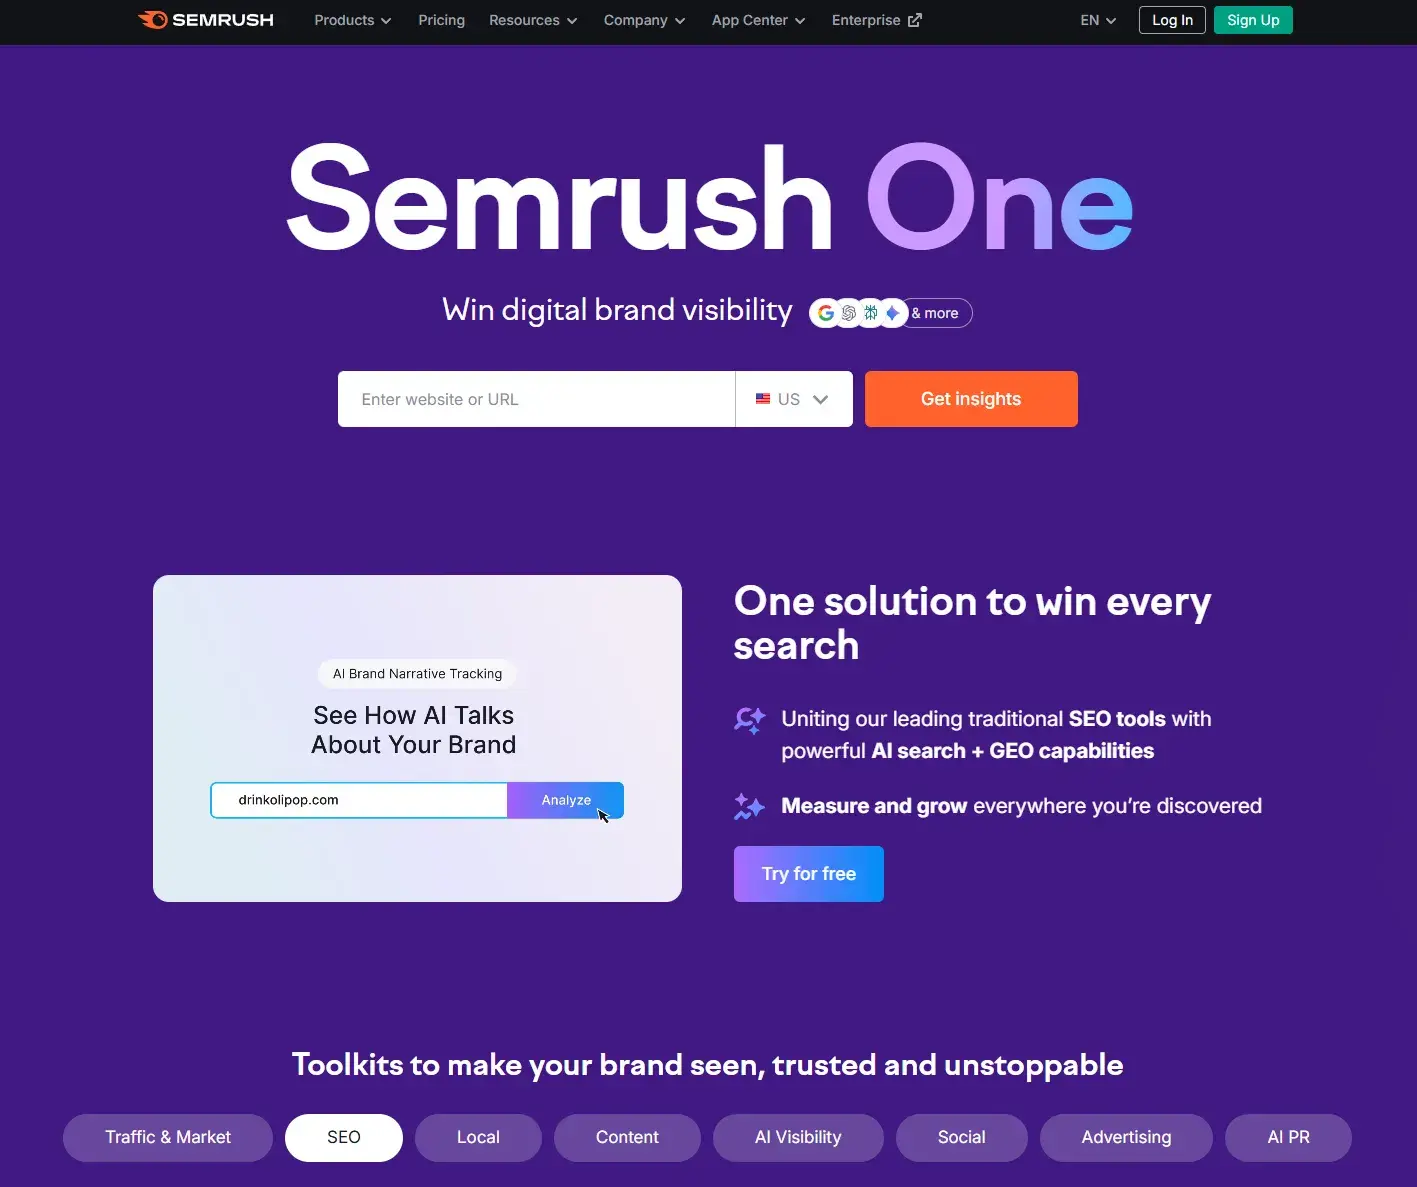
The Power of Advanced Analytics Tools
![Average engagement rates for 12 industries [2026 update]](https://blog.hootsuite.com/wp-content/uploads/2025/03/image-61-620x413.png)
Manually calculating engagement rates across multiple platforms and comparing them to industry averages can be a daunting and time-consuming task. This is where advanced social media analytics tools, such as Hootsuite Analytics, become indispensable. These platforms automate the data collection and analysis process, providing real-time insights into performance across Facebook, Instagram, Twitter, LinkedIn, and TikTok.
With such tools, brands can:
![Average engagement rates for 12 industries [2026 update]](https://blog.hootsuite.com/wp-content/uploads/2025/03/image-62-620x413.png)
- Centralize Data: View all social media performance metrics in one unified dashboard.
- Track Key Metrics: Monitor engagement rates, reach, impressions, audience growth, and more.
- Benchmark Against Competitors: Gain competitive intelligence by comparing performance not just to industry averages but also to specific hand-picked competitors.
- Identify Top-Performing Content: Pinpoint which posts, formats, and campaigns resonate most with the audience.
- Optimize Posting Schedules: Determine the best times to post for maximum engagement based on historical data.
- Generate Customizable Reports: Create detailed reports to share with stakeholders, demonstrating ROI and informing future strategy.
Expert Commentary and Future Outlook
Industry analysts emphasize that while benchmarks provide a crucial starting point, true success lies in continuous adaptation and experimentation. "The digital landscape is constantly evolving," notes Dr. Eleanor Vance, a leading social media strategist. "What works today might not work tomorrow. Brands must treat these benchmarks not as static targets but as dynamic guides. Consistent A/B testing, audience segmentation, and a willingness to embrace new content formats are key to maintaining and growing engagement."
![Average engagement rates for 12 industries [2026 update]](https://blog.hootsuite.com/wp-content/uploads/2025/03/image-63-620x413.png)
The increasing sophistication of platform algorithms means that authentic, high-quality content will continue to be rewarded. Brands that focus on building genuine connections, providing value, and participating in conversations rather than simply broadcasting messages are likely to see sustained success. The rise of short-form video and interactive features also suggests a future where dynamic, engaging multimedia content will increasingly drive social media performance.
Conclusion
![Average engagement rates for 12 industries [2026 update]](https://blog.hootsuite.com/wp-content/uploads/2025/03/image-64-620x413.png)
In an age defined by digital connectivity, understanding and optimizing social media engagement is paramount for any organization. The latest benchmarks, particularly those highlighting Instagram’s dominance and the specific challenges and opportunities presented by platforms like TikTok and LinkedIn, offer a clear call to action for marketers. By comparing their performance against industry averages and leveraging powerful analytics tools, brands can move beyond guesswork to implement data-driven strategies that foster meaningful interactions, build stronger communities, and ultimately drive business success. The journey to exceptional social media performance is continuous, requiring constant monitoring, strategic adaptation, and a deep understanding of what truly resonates with diverse online audiences.
FAQ: Average Engagement Rates
![Average engagement rates for 12 industries [2026 update]](https://blog.hootsuite.com/wp-content/uploads/2025/03/image-65-620x413.png)
What constitutes a good engagement rate on social media?
A good engagement rate typically ranges between 1% and 5%, though this is highly dependent on the specific industry and social media platform. For instance, an engagement rate above 3% is considered strong on Instagram and LinkedIn, reflecting a highly interactive audience. In contrast, on platforms like Facebook and TikTok, a rate between 1% and 2% is often closer to the industry norm due to differing algorithms and content consumption patterns.
How is the average engagement rate calculated across platforms?
The most common method for calculating engagement rate per post involves summing the total number of engagements (such as likes, comments, shares, and saves) on a piece of content, dividing that sum by the number of followers the account has, and then multiplying by 100 to express it as a percentage. Alternatively, the denominator can be swapped out for other metrics like impressions or reach, depending on the specific analytical goal (e.g., engagement rate by reach measures interaction relative to how many unique users saw the content).
![Average engagement rates for 12 industries [2026 update]](https://blog.hootsuite.com/wp-content/uploads/2025/03/image-66-620x413.png)
What key factors influence a brand’s average engagement rate?
Several critical factors collectively shape a brand’s engagement rate. These include the industry it operates within, the size and nature of its audience, the specific social media platforms chosen for marketing efforts, the quality and format of the content produced, and the consistency of its posting schedule. Generally, smaller accounts often exhibit higher engagement rates because their audiences tend to be more tightly knit and invested. Visually appealing and interactive content formats typically outperform text-only posts. Furthermore, the proprietary algorithms of each social media platform play a significant role in determining the visibility and reach of a post, thereby influencing potential engagement.
How do engagement rate benchmarks differ by industry and platform?
Engagement rates demonstrate substantial variability across both industries and platforms. Sectors such as construction, education, and nonprofits frequently achieve higher average engagement rates, often due to niche appeal, strong community ties, or mission-driven content. From a platform perspective, Instagram and LinkedIn typically report higher average engagement rates, around 3.5% and 3.4% respectively, fostering environments conducive to interaction. Conversely, platforms like Facebook and TikTok generally show lower average rates, approximately 1.3% and 1.5%, demanding highly tailored content strategies to break through.
![Average engagement rates for 12 industries [2026 update]](https://blog.hootsuite.com/wp-content/uploads/2025/03/image-67-620x413.png)
Which metric is more important: average engagement rate or reach?
The importance of engagement rate versus reach is contingent on a brand’s specific marketing objectives. Engagement rate is a paramount metric for assessing content quality and audience resonance—it tells you how much your existing audience cares about what you post. Reach, on the other hand, is crucial when the primary goal is brand awareness and expanding visibility to new potential audiences. Tracking both metrics simultaneously provides a holistic view, enabling brands to identify content that not only reaches a wide audience but also deeply resonates with them, allowing for early detection of low engagement and subsequent content optimization.
What practical steps can brands take to enhance their engagement rate?
To improve engagement, brands must prioritize creating high-quality content that genuinely interests their target audience. A data-driven approach is essential: regularly reviewing engagement data helps identify which content types, formats, and topics perform best. Brands should then double down on successful strategies, consider boosting top-performing posts with paid promotion to extend their reach, and strategically use relevant hashtags to improve discoverability. Crucially, a willingness to routinely adjust and refine the content strategy based on analytical insights is key to fostering a more interactive and engaged social media presence.