 Sagoh

Forecasting the long-term financial effects of digital experiments remains one of the most debated topics within the Conversion Rate Optimization (CRO) industry. While data-driven decision-making is the cornerstone of modern e-commerce and SaaS management, the transition from a statistically significant "lift" in a controlled environment to a realized increase in a company’s Profit and Loss (P&L) statement is rarely a direct correlation. The central challenge lies in the inherent uncertainty of whether a 10% conversion increase observed during a two-week trial will actually manifest as a 10% increase in monthly recurring revenue once the change is permanently deployed.

Even when an experimental result is statistically valid, numerous external variables exert pressure on the outcome. Digital environments are not static; they are influenced by shifts in advertising spend, the emergence of new competitors outranking a brand for key search terms, fluctuating economic conditions, and seasonal volatility. Consequently, the CRO industry has moved toward more sophisticated, conservative modeling to provide executives with realistic expectations rather than optimistic projections.
The Statistical Foundation of Revenue Projections
To build a credible revenue forecast, practitioners must first ensure the integrity of the underlying data. Controlled, randomized A/B testing is widely regarded as the "gold standard" for proving causality, a methodology borrowed from clinical trials in the medical industry. By isolating a single variable and measuring its impact against a control group, businesses can confidently assert that a specific change—rather than a random market fluctuation—caused the observed behavior.

However, the quality of a revenue forecast is only as high as the statistical rigor applied to the individual experiments. Industry experts emphasize several critical parameters for maintaining this rigor:
- Adequate Statistical Power: Experiments must reach a threshold where the sample size is large enough to detect a true effect, minimizing the risk of Type II errors (false negatives).
- Significance Thresholds: Standard industry practice usually requires a 95% confidence level, ensuring that the results are not the product of random noise.
- Representativeness: The traffic segment involved in the test must accurately reflect the broader audience that will interact with the permanent implementation.
Without these foundational elements, any attempt to project revenue becomes an exercise in speculation rather than empirical analysis.
The Fallacy of Linear Extrapolation
A common pitfall in digital marketing is the "linear extrapolation" of test results. It is a frequent occurrence in industry case studies to see claims that a minor adjustment to a checkout button increased annual revenue by millions of dollars. These calculations typically take the percentage lift from a brief test and multiply it by the company’s total annual revenue. For instance, an e-commerce platform generating $20 million annually might claim a $2 million gain from a test showing a 10% lift.
This approach is widely considered unrealistic by veteran data scientists for three primary reasons:
The Novelty Effect
Users often react positively to any change simply because it is new. Over time, this "novelty effect" wears off as the change becomes part of the standard user experience, leading to a regression toward the mean.
Selection Bias and Segmented Traffic
Tests are frequently conducted on specific segments—such as mobile users or first-time visitors. Applying the lift observed in a narrow segment to the entire revenue stream ignores the fact that other segments may react differently or not be exposed to the change at all.
External Market Dynamics
Revenue is a "noisy" metric. If a company reduces its ad budget or a holiday season concludes shortly after a test, the overall revenue may drop even if the CRO implementation is performing as expected. This creates a "net-flat" result that can be difficult to explain to stakeholders who were promised a significant increase.
Implementing a Conservative Forecasting Model
To maintain credibility with executive leadership, CRO practitioners are increasingly adopting "conservative" or "haircut" models. These models intentionally deflate the raw percentage lift of an experiment to account for the aforementioned uncertainties. A robust projection model typically includes several layers of adjustment.

The "Haircut" Adjustment
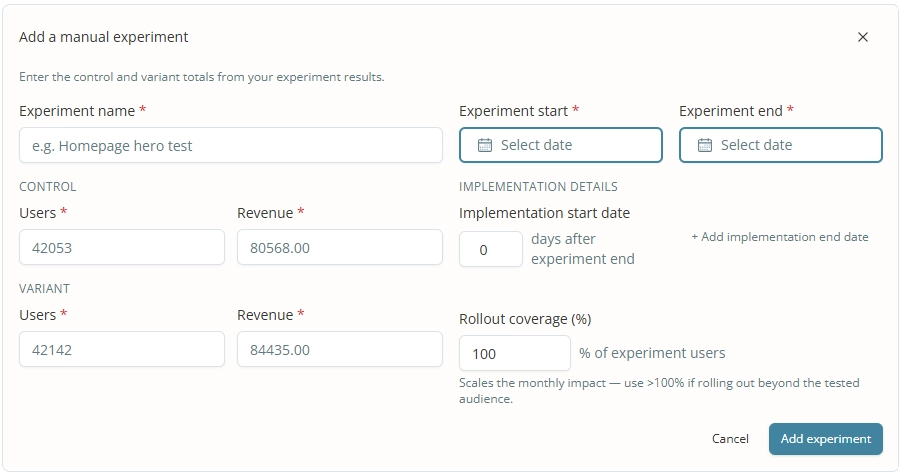
A standard conservative approach involves taking an immediate 10% to 20% "haircut" on the observed lift. If an experiment shows a 10% increase in Revenue Per User (RPU), the forecast might only utilize an 8% or 9% increase as the baseline for its projections.
Rollout Coverage Adjustments
This represents the relationship between the users targeted in the test and the users who will see the change in production. If a test was performed only on a specific product category page that accounts for only 20% of total site traffic, the revenue impact must be scaled down accordingly. Conversely, if a change tested on one page is implemented across the entire site, the "rollout coverage" might exceed 100%.
The Decay Rate
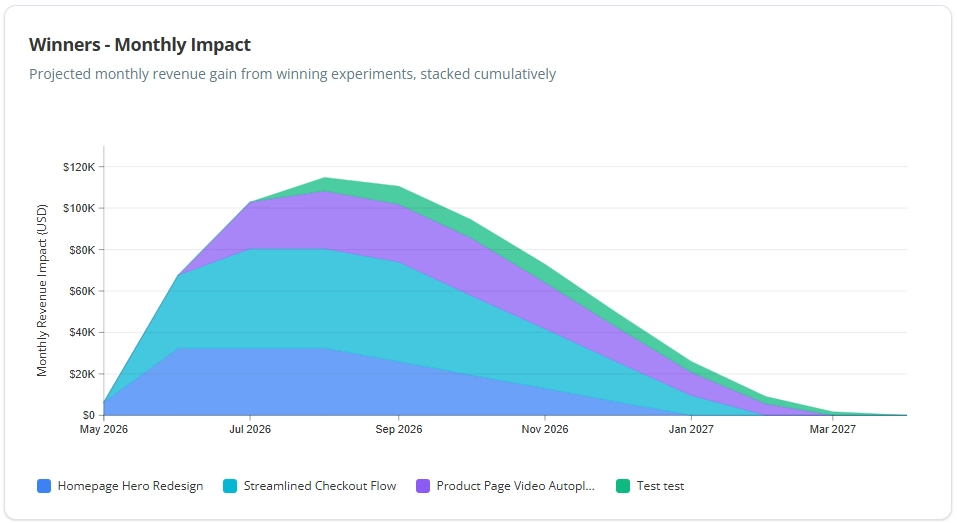
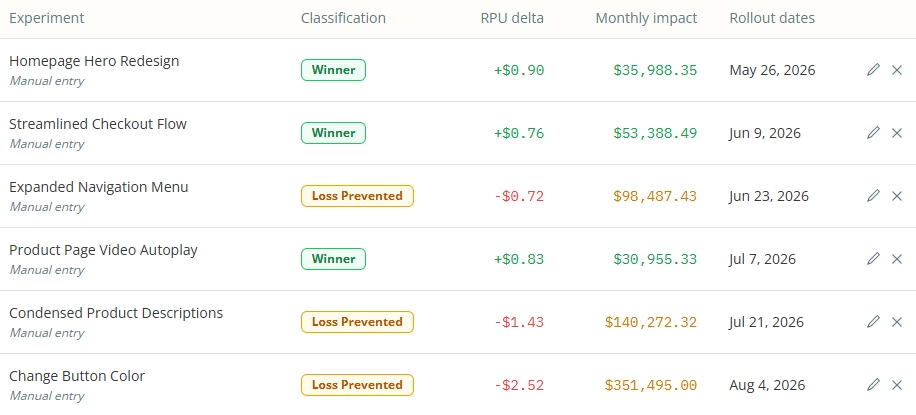
No experimental win lasts forever. Market conditions and user preferences evolve. A realistic model assumes the impact of a winning experiment will remain steady for a short period (e.g., four months) before undergoing a monthly "decay" (e.g., a 20% reduction in impact per month) until it reaches zero or a negligible baseline.
A Step-by-Step Methodology for Calculation
The actual calculation of projected revenue requires a systematic approach to aggregate data from multiple experiments. The process generally follows this chronology:
- Calculate Baseline RPU: Establish the Revenue Per User for the control group during the test period.
- Determine the Absolute Lift: Subtract the control RPU from the variant RPU to find the gain per user.
- Apply the Conservative Discount: Reduce the absolute lift by a predetermined percentage (the "haircut").
- Scale by Traffic: Multiply the discounted lift by the total number of users expected to be exposed to the change over a specific future period.
- Factor in Timing: Determine when the change will be officially "shipped" to production, as the revenue impact cannot begin until implementation is complete.
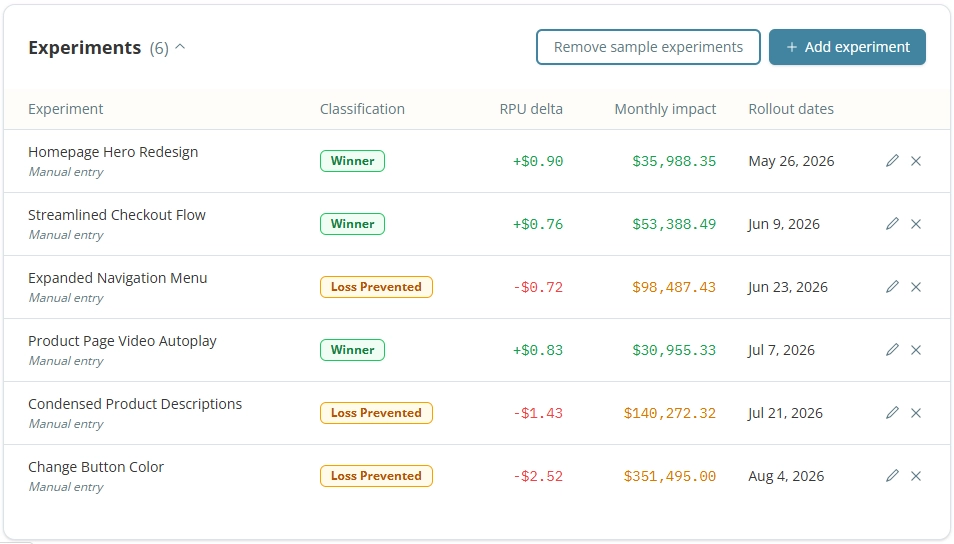
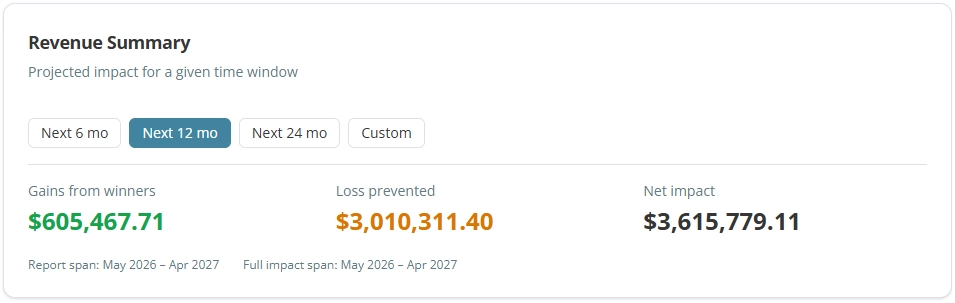
For organizations running dozens of tests simultaneously, tools like Katsed or specialized internal dashboards are used to stack these individual impacts. This allows for a cumulative view of how various "wins" contribute to the bottom line over a fiscal year.
Stakeholder Management and the "Model" Mindset
One of the greatest hurdles for CRO teams is the psychological barrier to forecasting. Many practitioners shy away from revenue projections because they cannot guarantee 100% accuracy. However, in a corporate environment, the C-suite operates on estimates and models.
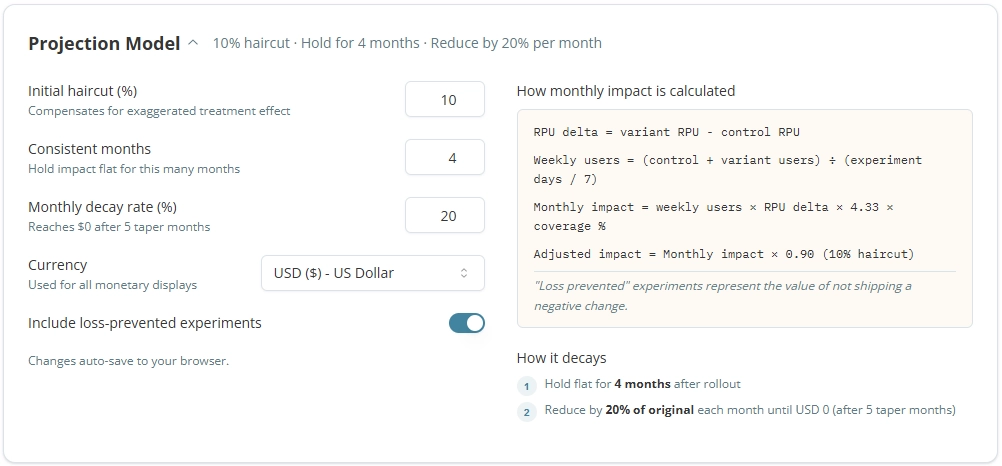
Financial analysts and executives are accustomed to working with models that have built-in assumptions. The key to successful reporting is not providing a perfect number, but rather being transparent about the assumptions. By explicitly stating the decay rates, haircut percentages, and rollout coverage used in the model, CRO teams can move the conversation away from "Is this number exactly right?" to "Is this methodology sound?"
Furthermore, reporting should include "Loss Prevented" metrics. If an experiment shows that a proposed feature would have decreased revenue by 5%, stopping that feature from being implemented is a tangible financial win that should be captured in the broader value of the experimentation program.

Analyzing the Return on Investment (ROI)
Projecting revenue is only one side of the equation; to prove the true value of an experimentation program, these gains must be measured against costs. A comprehensive ROI analysis includes:
- Human Capital: The salaries of the CRO team, including data scientists, designers, and developers.
- Technological Overhead: The cost of A/B testing platforms, analytics tools, and server-side implementation.
- Opportunity Costs: The engineering capacity diverted from other projects to build and implement tests.
When revenue projections are compared against these costs, most mature experimentation programs find a significant multiplier. By focusing on the "net impact" over a 12-month trailing period, organizations can justify the continued expansion of their testing budgets even during economic downturns.

Conclusion and Broader Implications
Forecasting the revenue impact of CRO experiments is an essential, albeit imperfect, science. It serves as the bridge between the technical world of p-values and the financial world of quarterly earnings. As the digital landscape becomes increasingly competitive and acquisition costs continue to rise, the ability to squeeze more value out of existing traffic becomes a primary lever for growth.
The shift toward conservative, decay-based modeling reflects a maturing industry. By moving away from "vanity metrics" and toward robust fiscal projections, CRO professionals can secure their seat at the executive table. The ultimate goal of revenue forecasting is not to predict the future with absolute certainty, but to provide a logical, data-backed framework for making strategic investments in the user experience. As long as the assumptions are clear and the statistical methods are sound, these models remain the most powerful tool for quantifying the value of human-centric experimentation.

 Siti Muinah