
 Nana

In an era where digital presence is paramount, businesses are increasingly scrutinizing every marketing dollar spent, demanding concrete evidence of return on investment (ROI). For social media, long celebrated for its capacity to build brand awareness and foster community engagement, the challenge has shifted from merely garnering "likes" and "shares" to demonstrating tangible contributions to the bottom line. This evolving landscape underscores the critical necessity of robust analytics, with Google Analytics 4 (GA4) emerging as the indispensable tool for connecting social media activity to measurable business outcomes such as website traffic, lead generation, and direct sales. The transition from Universal Analytics (UA) to GA4, completed in July 2023, has further solidified its role as the industry standard for comprehensive web analytics, compelling marketers to adapt and leverage its advanced capabilities to validate their social media strategies.

The Paradigm Shift: From Vanity Metrics to Verifiable Conversions
For years, social media success was often quantified by surface-level metrics: follower counts, post reach, likes, and comments. While these "vanity metrics" offer a snapshot of content performance on specific platforms, they frequently fail to answer the fundamental question posed by executive leadership: "What real business value does this generate?" This disconnect has fueled a growing demand for deeper analytical insights, pushing social media professionals to move beyond platform-native analytics, which excel at optimizing on-platform content, towards tools that track the customer journey after a social media click.

Industry data consistently highlights this shift. A recent report by Statista indicates that global social media advertising spend reached approximately $207 billion in 2023, projected to grow to over $300 billion by 2027. With such significant investments, businesses cannot afford to operate without clear metrics demonstrating efficacy. GA4, with its event-driven data model, provides the granular detail necessary to trace a user’s path from a social media post to a website conversion, offering a holistic view that native analytics simply cannot provide. It measures critical on-site activities such as user sessions, engagement rates, and key events—the new terminology for conversions—thereby bridging the gap between social media engagement and actual business impact. Marketing strategists widely agree that relying solely on platform-specific engagement figures no longer suffices in today’s performance-driven environment.
GA4’s Ascent: A Timeline of Analytical Evolution

The journey towards comprehensive digital analytics has been progressive, culminating in the widespread adoption of GA4. Google Analytics, initially launched in 2005, evolved through several iterations, with Universal Analytics (UA) becoming the dominant platform for over a decade. UA provided robust session-based tracking, but its limitations became apparent with the rise of cross-device user journeys and increasing privacy regulations.
The introduction of GA4 in October 2020 marked a significant departure from its predecessors. Designed with a privacy-centric approach and an event-based data model, GA4 was built to track user behavior across multiple platforms and devices more effectively. This shift was not merely an upgrade but a fundamental re-architecture, enabling more flexible and insightful reporting, particularly for understanding complex customer pathways. The pivotal moment arrived on July 1, 2023, when Universal Analytics ceased processing new data, making GA4 the sole standard for Google’s analytics offerings. This sunsetting event forced a rapid migration for countless businesses, accelerating the learning curve for marketers and analysts alike. The timing coincided with heightened corporate emphasis on data privacy, making GA4’s cookieless measurement capabilities and enhanced consent management features particularly pertinent. This chronological development underscores GA4’s role not just as a tool, but as a strategic response to evolving digital marketing demands and regulatory landscapes. Analysts noted that this transition represented Google’s commitment to a future of analytics built on machine learning and a more durable measurement infrastructure.
Demystifying the Setup: Key Pillars for Social Media Tracking in GA4
Successfully leveraging GA4 for social media ROI requires a methodical approach, focusing on four foundational pillars. While the process may involve technical steps, its strategic benefits far outweigh the initial effort, often achievable within a single business day.
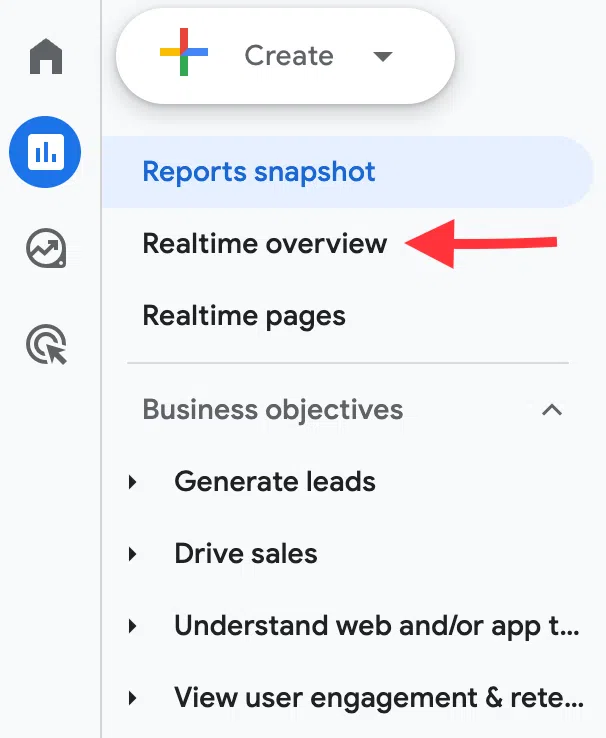
The first critical step is confirming GA4 installation and data collection. A common oversight, a misconfigured or broken tracking tag can render all subsequent efforts futile. Marketers are advised to verify their GA4 property is actively collecting data by checking the "Realtime overview report" within the GA4 interface. This report offers immediate insights into active users and events, serving as a quick diagnostic tool. Should data not appear, a review of the web stream settings under "Admin > Data collection and modification > Data streams" is essential to ensure proper implementation. This initial validation ensures the foundational layer of data collection is sound, preventing erroneous conclusions from incomplete data.
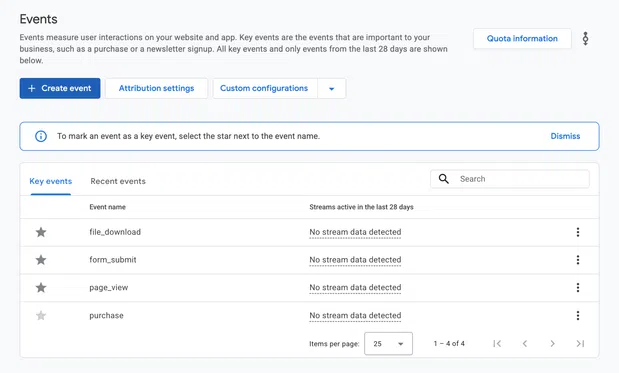
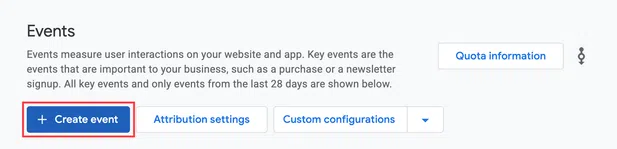
Secondly, setting up key events that matter is paramount. GA4’s event-driven model replaces UA’s "goals" with "key events," representing specific actions on a website that hold business value. These might include newsletter sign-ups, demo requests, e-book downloads, product purchases, or content views on critical pages. Identifying these high-value actions is crucial for defining what constitutes a "conversion" from social media efforts. Once identified, these events must be configured within GA4, either by marking existing tracked events as key events (Admin > Data display > Events) or by creating new custom events if they are not automatically captured. This step transforms raw website activity into actionable business intelligence, directly linking social media interactions to tangible business objectives. For e-commerce businesses, tracking "purchase" events with associated revenue data is fundamental, while B2B companies prioritize "form_submission" or "lead_generation" events.
The third, and arguably most critical, pillar is tagging every social link with UTM parameters. UTM (Urchin Tracking Module) parameters are short text codes appended to a URL, acting as vital metadata for GA4. They provide precise information about the source, medium, campaign, and even specific content of a click. Without consistent UTM tagging, GA4 struggles to accurately attribute website traffic to social media, often miscategorizing it as "direct" or "referral" traffic. For instance, a link like www.example.com/?utm_source=tiktok&utm_medium=social&utm_campaign=q4_ebook clearly tells GA4 that a visitor originated from TikTok (source), via an organic social post (medium), as part of a Q4 e-book campaign (campaign). Standardizing these parameters across all social platforms and campaigns is essential to prevent data fragmentation and ensure accurate reporting. The strategic use of utm_content can further differentiate between specific posts or creative variations, offering granular insights into content performance, allowing marketers to determine which specific assets are most effective.
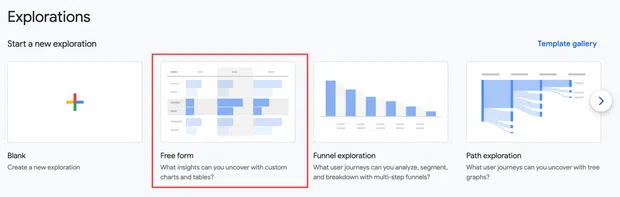
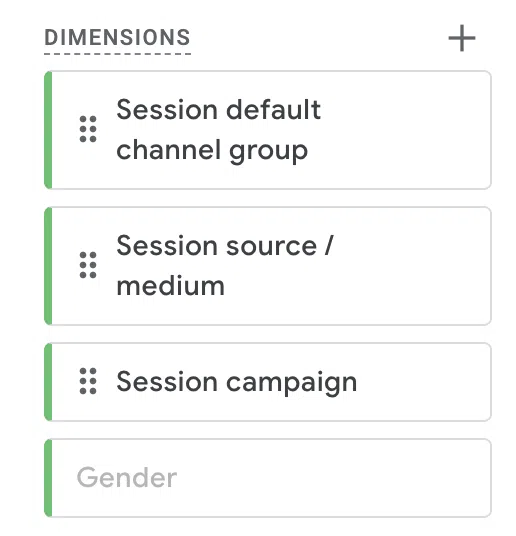
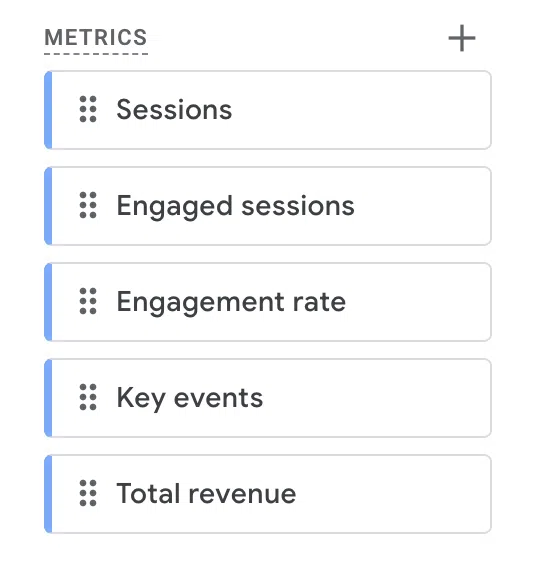
Finally, building a social traffic view in GA4’s Explore section provides a customized lens for analyzing social media performance. While GA4 offers standard reports, a dedicated exploration report allows marketers to filter for social-specific data and customize metrics. By creating a "Free form" exploration, importing dimensions such as "Session source / medium," "Session campaign," and "User first open / acquisition source," alongside metrics like "Sessions," "Engaged sessions," "Key events," and "Revenue," social media teams can construct a dashboard tailored to their reporting needs. This custom view eliminates the noise of other traffic sources, allowing for a focused analysis of social media’s contribution to website performance and business objectives without needing to rebuild reports repeatedly, as GA4 automatically saves these explorations. This capability is particularly valued by agencies and in-house teams managing multiple social channels and campaigns simultaneously.
Unveiling Insights: Essential GA4 Reports and Metrics
Once the foundational setup is complete, GA4 provides a suite of powerful reports that offer deep insights into social media performance. These reports, when combined with strategically chosen metrics, paint a comprehensive picture of social media’s value.
-
Traffic Acquisition Report: Located under Reports > Acquisition, this report reveals how much traffic social media channels send to a website and what users do upon arrival. GA4 automatically categorizes traffic into channels like "Organic Social" and "Paid Social," allowing for a direct comparison of social’s performance against other channels like organic search, email, or direct traffic. Key metrics here include sessions, engagement rate, and key events, providing a macro view of social’s effectiveness in driving website activity.
-
User Acquisition Report: Found alongside Traffic Acquisition, this report focuses on new users, attributing them to the very first channel that brought them to the site. This is crucial for understanding whether social media is effectively introducing new audiences to a brand or primarily re-engaging existing ones. For brands focused on growth and market expansion, this report is invaluable for demonstrating social media’s role in expanding the customer base.
-
Landing Page Report: Under Reports > Engagement, this report details which specific landing pages are receiving traffic from social media and how those pages perform. It helps optimize content strategy by showing which types of content or offers resonate most effectively with social audiences, leading to higher engagement or conversion rates. Analyzing bounce rates and average engagement time on social-driven landing pages can provide actionable insights for content refinement.
-
Attribution Paths Report: Located under Advertising > Attribution, this advanced report sheds light on the multi-touch customer journey. Social media often plays an early role in discovery, even if another channel receives the final conversion credit. This report illustrates the entire path, showing how social interactions might precede, influence, or assist conversions that ultimately occur through email, organic search, or direct visits. For instance, a user might discover a product on TikTok, research it via Google a week later, and then make a purchase through an email link. The attribution path report ensures social media’s contribution to this journey is recognized, allowing for a more accurate assessment of its overall value beyond just the last click.

To truly understand social media’s impact, marketers should track a balanced set of metrics across different categories:
- Traffic Metrics: Users (the number of unique individuals visiting) and Sessions (the total number of visits). These foundational metrics indicate the volume of traffic driven by social.
- Engagement Metrics: Engagement Rate (percentage of sessions that lasted longer than 10 seconds, had a conversion event, or had 2+ page views) and Average Engagement Time (the average time users spent actively on the site). These metrics reveal the quality of social traffic—whether visitors are genuinely interested and interacting with content.
- Conversion Metrics: Key Events (the number of times important actions occurred) and Key Event Rate (the percentage of sessions resulting in a key event). These directly link social activity to desired business outcomes.
- Revenue Metrics: Revenue (total income from social-driven purchases) and Key Event Value (monetary value assigned to specific key events, e.g., a demo request valued at $200). These metrics quantify social media’s financial contribution, which is often the most compelling data for executive


 Ammar Sabilarrohman

 Suro Senen