The practice of forecasting the long-term financial impact of conversion rate optimization (CRO) experiments remains one of the most debated subjects within the digital marketing and data science communities. While the goal of any optimization program is to drive measurable business growth, the transition from a statistically significant experiment result to a reliable revenue projection is fraught with complexity. Practitioners frequently grapple with the central question of whether a observed 10% lift in a controlled environment will actually manifest as a 10% increase in total monthly revenue once a change is permanently deployed. This skepticism is rooted in the reality of the "leaky bucket" of digital commerce, where external variables often dilute the perceived gains of individual tests.

The Problem of Causality in Revenue Attribution
The primary reason revenue forecasting remains controversial is the inherent difficulty in isolating the impact of a single website change from the myriad of other factors influencing a business’s bottom line. In a standard business environment, variables such as fluctuating advertising budgets, shifting competitor strategies, search engine algorithm updates, and broader macroeconomic conditions are constantly in flux. For example, a business might implement a high-performing checkout optimization, only to see overall revenue remain flat because a primary competitor simultaneously launched a major discount campaign or because seasonal demand naturally tapered off.
This challenge highlights why controlled A/B testing is considered the "gold standard" for proving causality. Unlike pre-post comparisons, which merely look at data before and after a change, A/B testing uses randomization to ensure that external factors affect both the control and the variant groups equally. If the variant outperforms the control during the test, the difference can be attributed to the change itself. However, the transition from this "micro-victory" to "macro-revenue" requires a sophisticated modeling approach that accounts for the reality of a live, evolving marketplace.

Establishing Statistical Rigor at the Experiment Level
Confidence in a revenue forecast is only as strong as the statistical foundation of the individual experiments that inform it. To move from raw data to a reliable forecast, organizations must adhere to robust experimental designs. This begins with the principle of statistical power. An underpowered test—one with too few participants—may produce a "winner" that is actually a result of random noise.
To ensure experiments provide a realistic view of future effects, practitioners must define clear parameters, including:
- Minimum Detectable Effect (MDE): Determining the smallest change in conversion rate that is worth the cost of implementation.
- Confidence Levels: Ensuring that the results are not due to chance, typically aiming for a 95% significance threshold.
- Sample Size Calculation: Pre-determining how many users must be exposed to the test to achieve a valid result.
By treating every experiment with the same level of rigor applied to clinical trials in the medical industry, CRO professionals can provide executives with the evidence needed to view optimization as a predictable driver of growth rather than a series of isolated "hacks."
The Necessity of Conservative Forecasting
Industry case studies often claim that a single A/B test resulted in "millions of dollars in additional revenue." While such wins occur, the methodology used to calculate these figures is often oversimplified. Frequently, these claims are generated by taking the percentage lift from a two-week test and multiplying it by the company’s total annual revenue. For a company generating $50 million annually, a 5% lift is thus presented as a $2.5 million gain.
In practice, this approach is rarely accurate for three critical reasons:
- The Novelty Effect: Users often respond positively to a change simply because it is new. Over time, this "spike" in engagement tends to normalize, and the long-term lift is often lower than the initial result.
- Selection Bias in Testing: Experiments are often run on specific segments or high-traffic pages. Applying the lift seen on a specific landing page to the entire site’s revenue assumes that every user interacts with that change, which is rarely the case.
- Regression to the Mean: High-performing variants in a short-term test often see their performance stabilize at a lower level when monitored over several months.
Beyond technical accuracy, there are significant political and professional reasons to adopt a conservative stance. Over-promising revenue gains that fail to appear on the balance sheet erodes the credibility of the CRO team. Conversely, a conservative model that consistently meets or slightly exceeds its projections builds long-term trust with the C-suite and secures ongoing budget for experimentation.
The "Haircut" Model: A Practical Framework for Projections
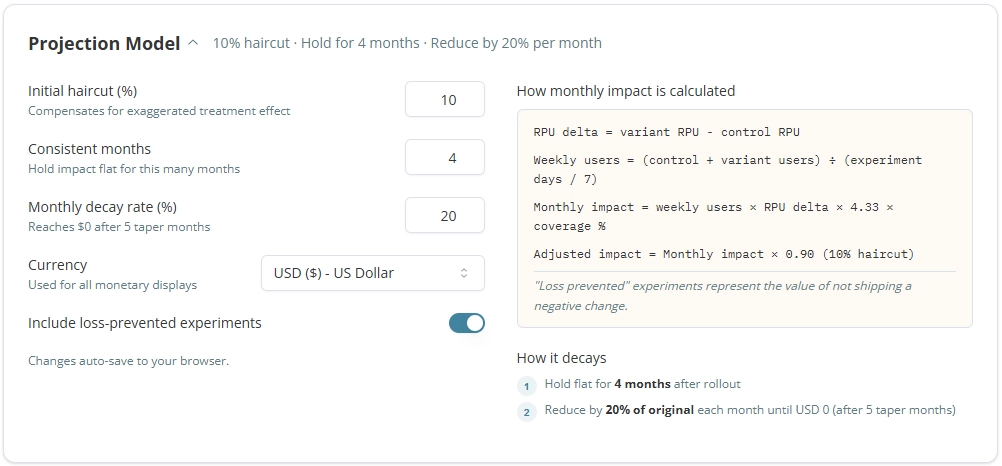
To create a realistic revenue forecast, seasoned practitioners apply a "haircut"—a deliberate reduction in the observed lift to account for uncertainty. A standard conservative model might look like the following:
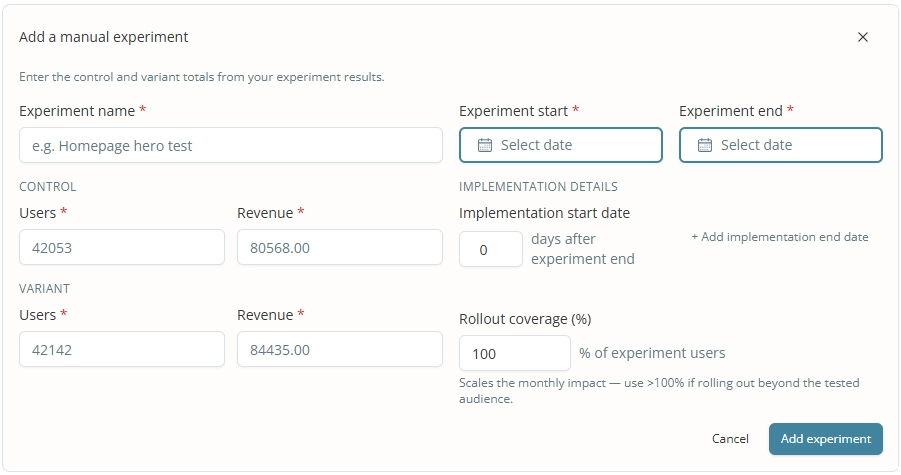
- The Initial Haircut: Reduce the observed lift by a set percentage (e.g., 10%) immediately to account for the difference between the testing environment and the permanent implementation.
- Implementation Delay: Account for the time between the end of a test and the actual code deployment. Revenue gains cannot be claimed for months where the change was not live.
- Rollout Coverage: Calculate exactly what percentage of total site traffic will be exposed to the change. If a test was run on mobile users only (representing 60% of traffic), the total revenue impact must be adjusted accordingly.
- Temporal Decay: Model a gradual decline in the impact of the change. A common approach is to hold the effect steady for three to four months and then reduce the projected impact by 20% month-over-month to account for market changes and the "wear-out" of the design.
For instance, if a test shows a 10% lift in Revenue Per User (RPU), a conservative forecast would first apply a 10% haircut (reducing the lift to 9%). If only 50% of the site’s users see this change, the effective lift on total revenue becomes 4.5%. This number is then phased out over time rather than being projected indefinitely.

Operationalizing the Data: Steps to Calculation
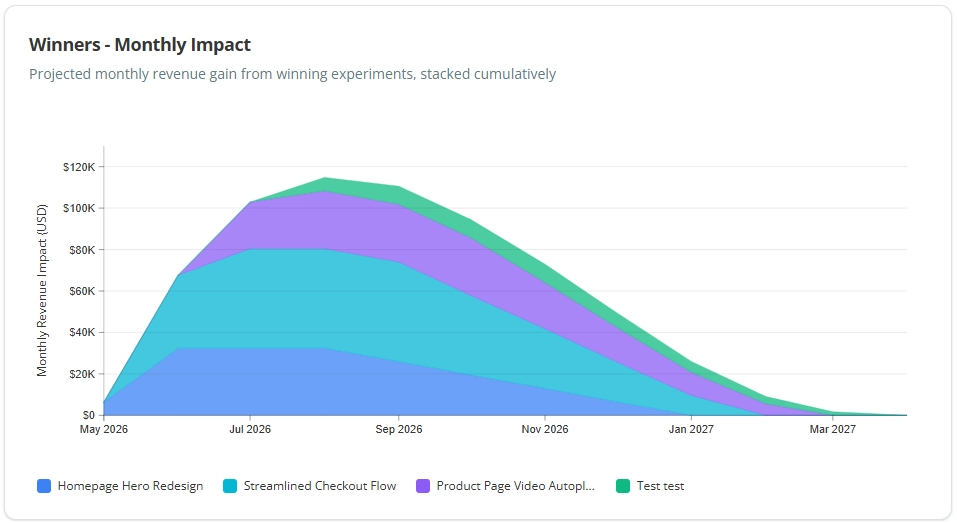
Translating these principles into a working model involves a systematic process of data aggregation. Organizations are increasingly moving away from manual spreadsheets toward specialized experimentation analytics tools, such as Katsed, which automate the stacking of cumulative impacts.
The calculation process typically follows these steps:
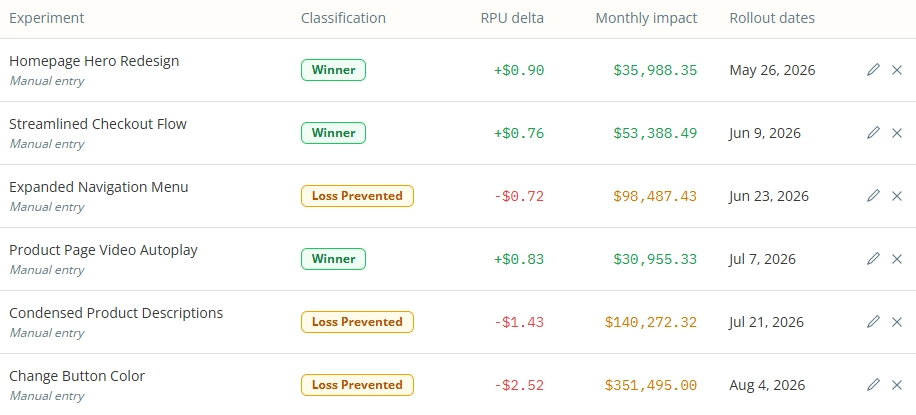
- Step 1: Identify the RPU of the control and the variant from the completed experiment.
- Step 2: Calculate the "lift" (Variant RPU minus Control RPU).
- Step 3: Multiply that lift by the total number of users expected to see the change in a given month.
- Step 4: Apply the conservative "haircut" and decay factors.
- Step 5: Repeat this for every winning experiment conducted within the period.
This cumulative approach allows for the creation of a "stacked" revenue chart, showing how multiple small wins from different months layer on top of one another to create a significant upward trend in baseline revenue.
Reporting to the Executive Level
One of the greatest hurdles for CRO programs is the "communication gap" between data analysts and executive leadership. While practitioners may want to discuss p-values and Bayesian versus Frequentist methodologies, executives are primarily concerned with ROI and predictable growth.
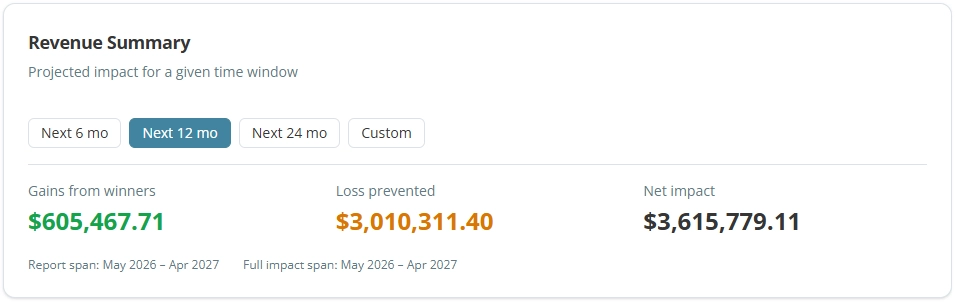
At the executive level, it is essential to accept that every revenue projection is a model, not a guarantee. The goal of the report should be to provide a "reasonable estimate" that informs resource allocation. When presenting these numbers, transparency regarding the assumptions—such as the decay rate and the haircut percentage—is vital. This transparency shifts the conversation from "Are these numbers exactly right?" to "Is our methodology sound?"
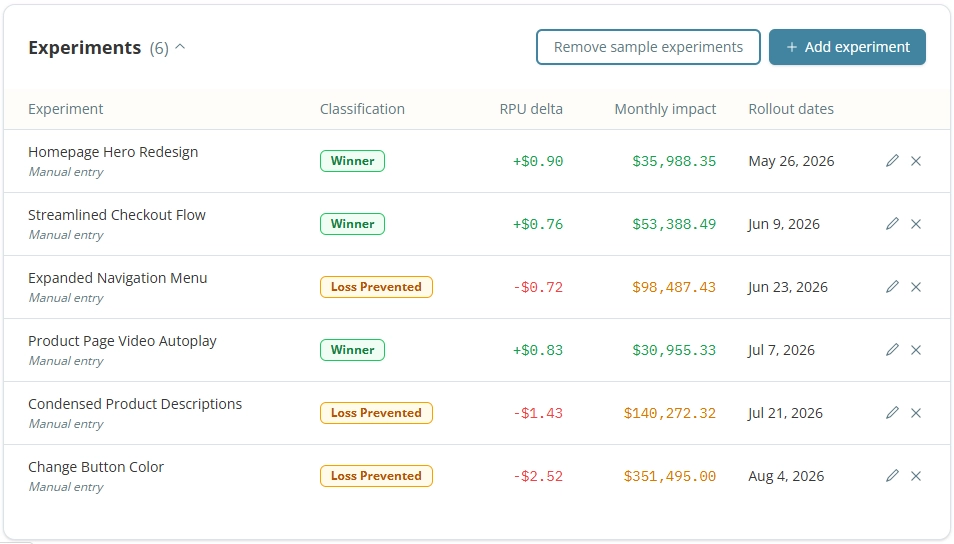
Furthermore, it is important to report on "Loss Prevented." Not every experiment results in a winner; many show that a proposed "improvement" would have actually decreased revenue. By identifying and stopping these negative changes, the CRO program provides a protective value that is just as important to the bottom line as finding new winners.
Evaluating Total Program ROI
The final piece of the revenue forecasting puzzle is the calculation of the Return on Investment (ROI). This involves comparing the projected revenue gains against the total cost of the experimentation program.
Costs to consider include:

- Personnel: Salaries for dedicated CRO managers, data analysts, and designers.
- Engineering: The cost of developer time used to build tests and implement winning variations.
- Technology: Licensing fees for A/B testing platforms and analytics tools.
By subtracting these costs from the conservative revenue projections, organizations can determine the true net value of their optimization efforts. In a mature program, the revenue gains from a single "home run" experiment often cover the entire program’s operating costs for a year, making the subsequent "base hits" pure profit.
Conclusion: The Future of Data-Driven Forecasting
Forecasting the revenue impact of CRO experiments is not an exact science, but it is a necessary discipline for any organization seeking to be truly data-driven. By moving away from aggressive, over-simplified projections and embracing conservative, model-based estimates, practitioners can provide a realistic view of how optimization contributes to the bottom line.

The value of this exercise lies not in achieving 100% accuracy, but in providing a consistent framework for decision-making. As tools for experimentation analytics continue to evolve, the ability to bridge the gap between statistical significance and financial reality will become the defining characteristic of successful optimization programs. In an increasingly competitive digital landscape, the organizations that can accurately forecast and prove the value of their experiments will be the ones that secure the investment needed to lead their industries.