The Evolution of Visual Analytics in the Modern Web
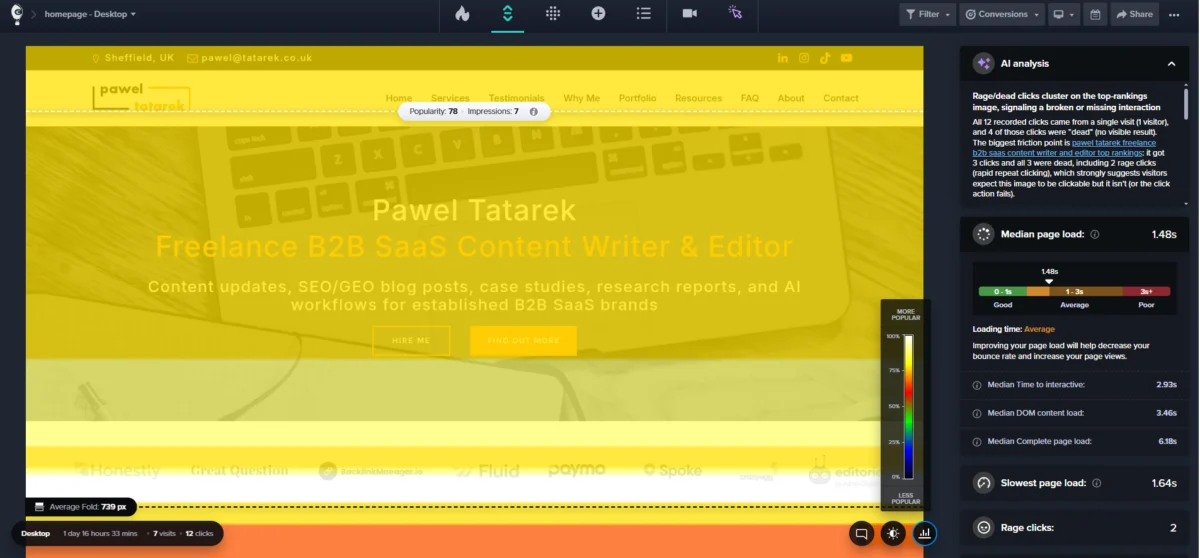
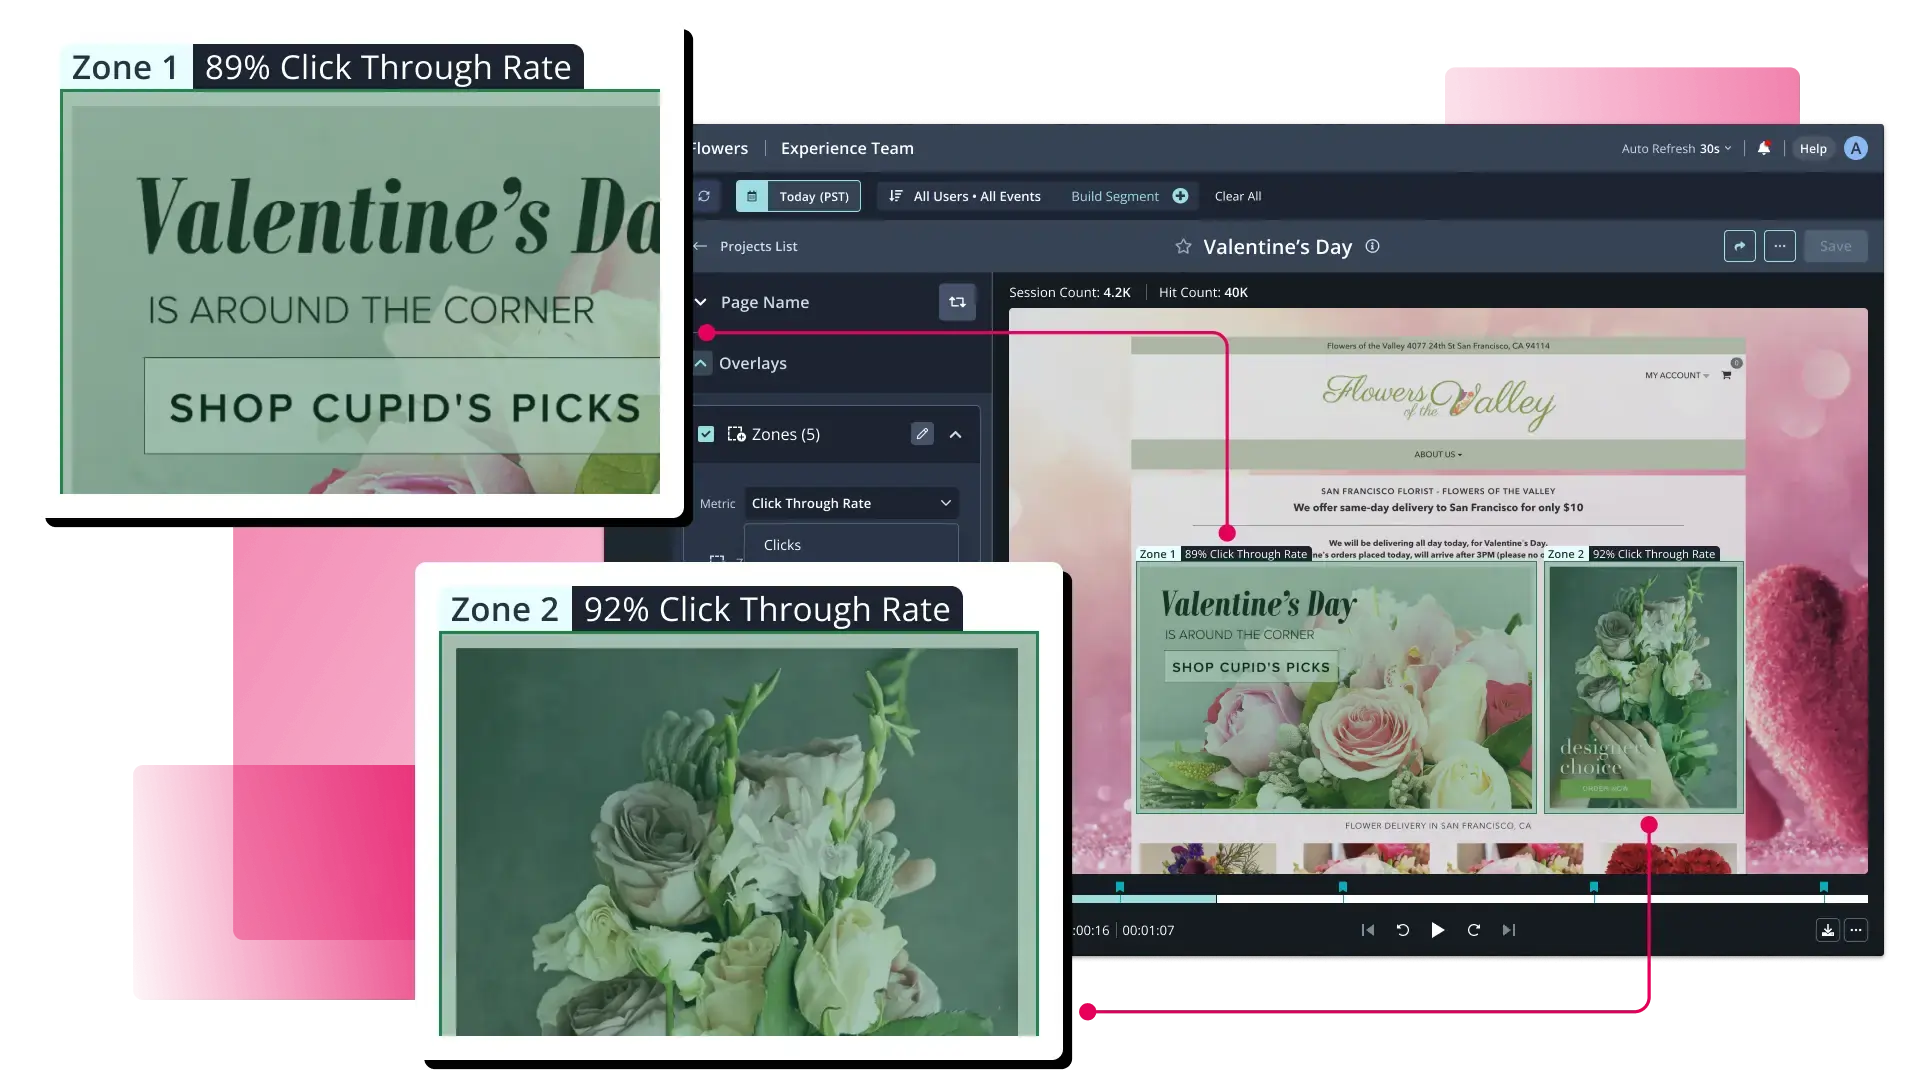
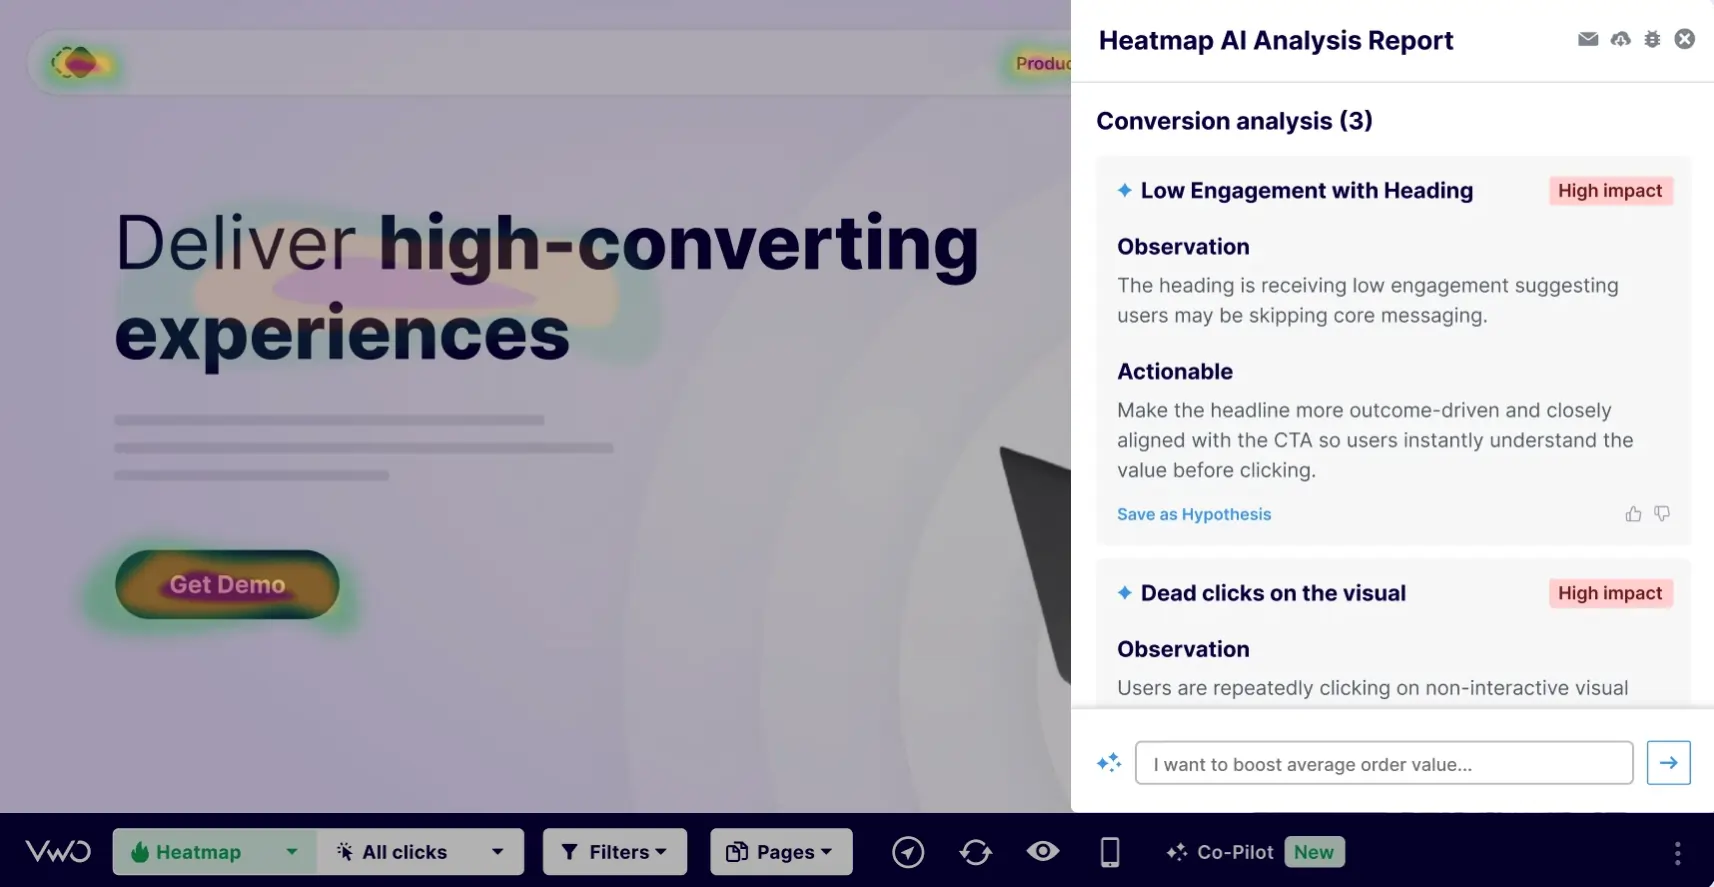
Heatmapping software represents a specialized category of behavioral analytics that translates raw interaction data into intuitive color-coded visualizations. By capturing every click, scroll, and mouse movement, these tools provide a "weather map" of user attention. In 2025, the technology has advanced beyond static screenshots to dynamic, real-time overlays that can track interactions on single-page applications (SPAs), AJAX-loaded content, and personalized user experiences.
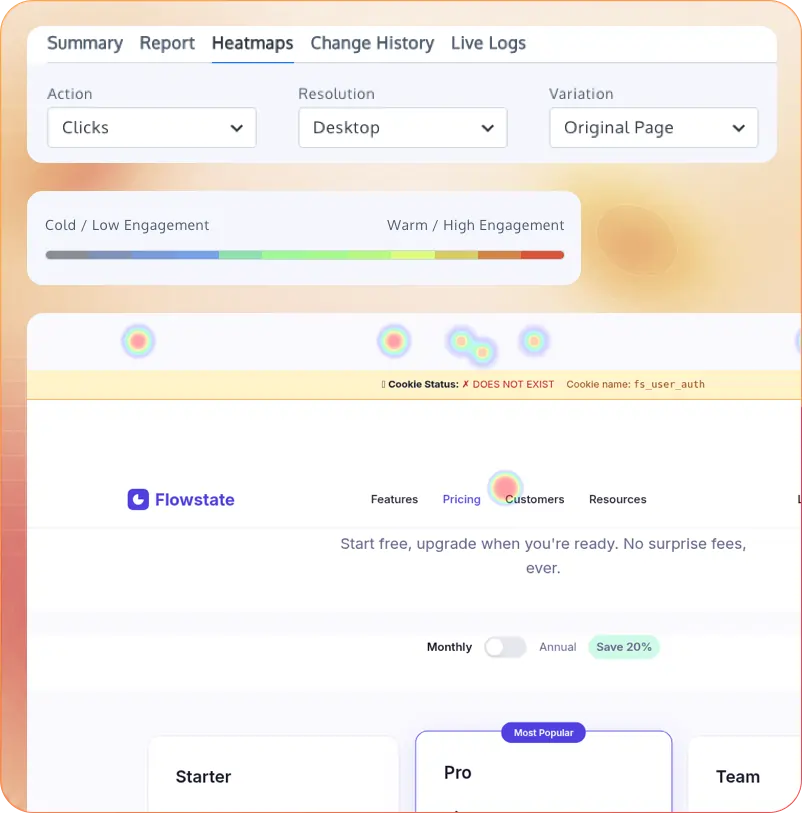
The necessity for these tools is underscored by recent industry data suggesting that even a one-second delay in page load or a minor navigation friction point can lead to a 7% reduction in conversions. Modern heatmapping solutions address these challenges by providing a qualitative layer to the quantitative data found in platforms like Google Analytics 4 (GA4). While GA4 tells a brand what happened, heatmaps explain why it happened.
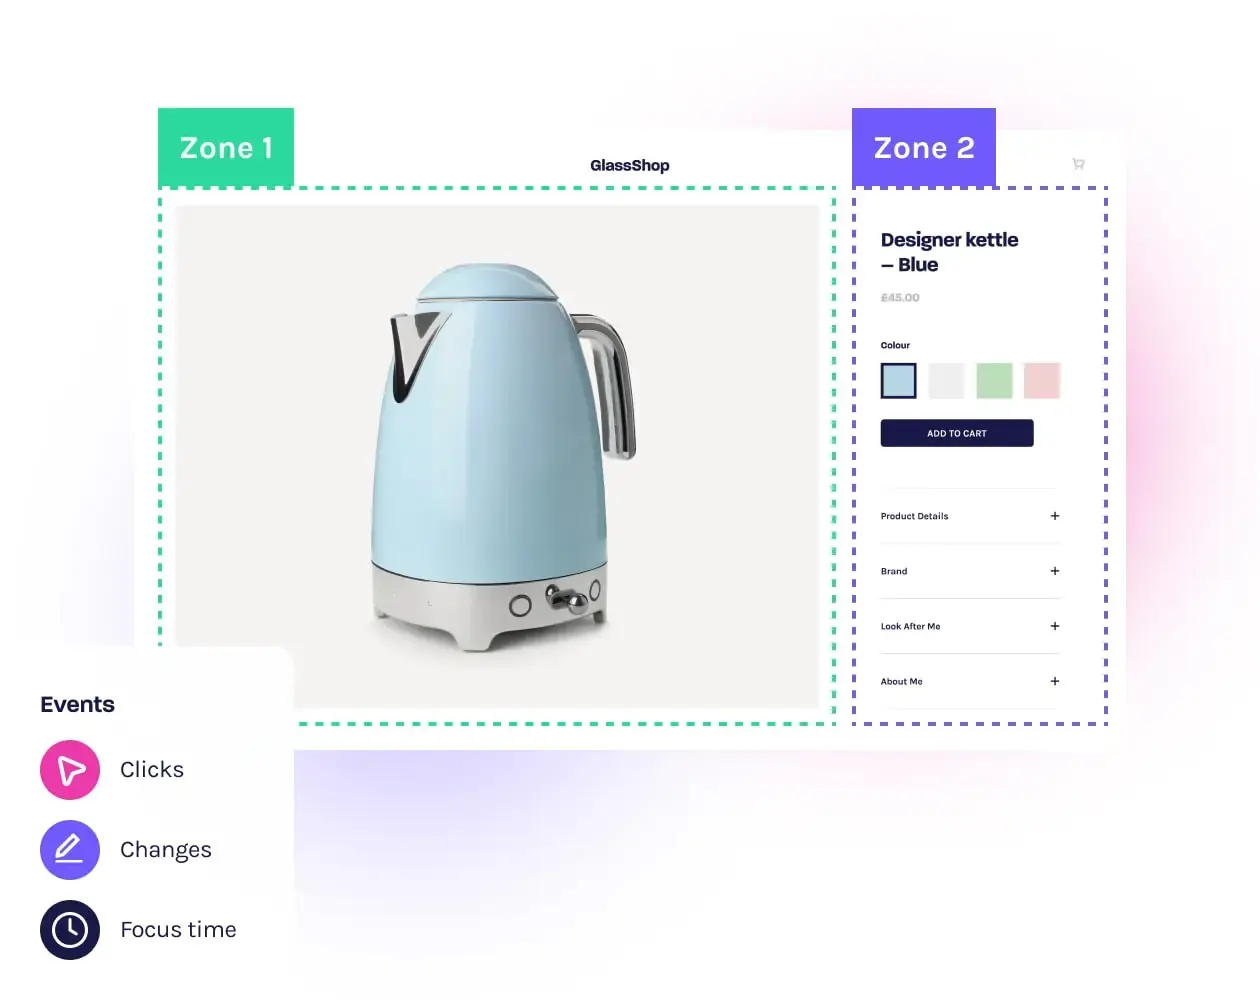
A Comparative Analysis of the Leading 2025 Heatmap Solutions
The market for heatmap tools is diverse, ranging from free, entry-level scripts to enterprise-grade suites that utilize artificial intelligence to predict user intent. Selecting the right platform requires an analysis of feature sets, integration capabilities, and pricing structures.
1. Convert Experiences: The Integration of Testing and Insight
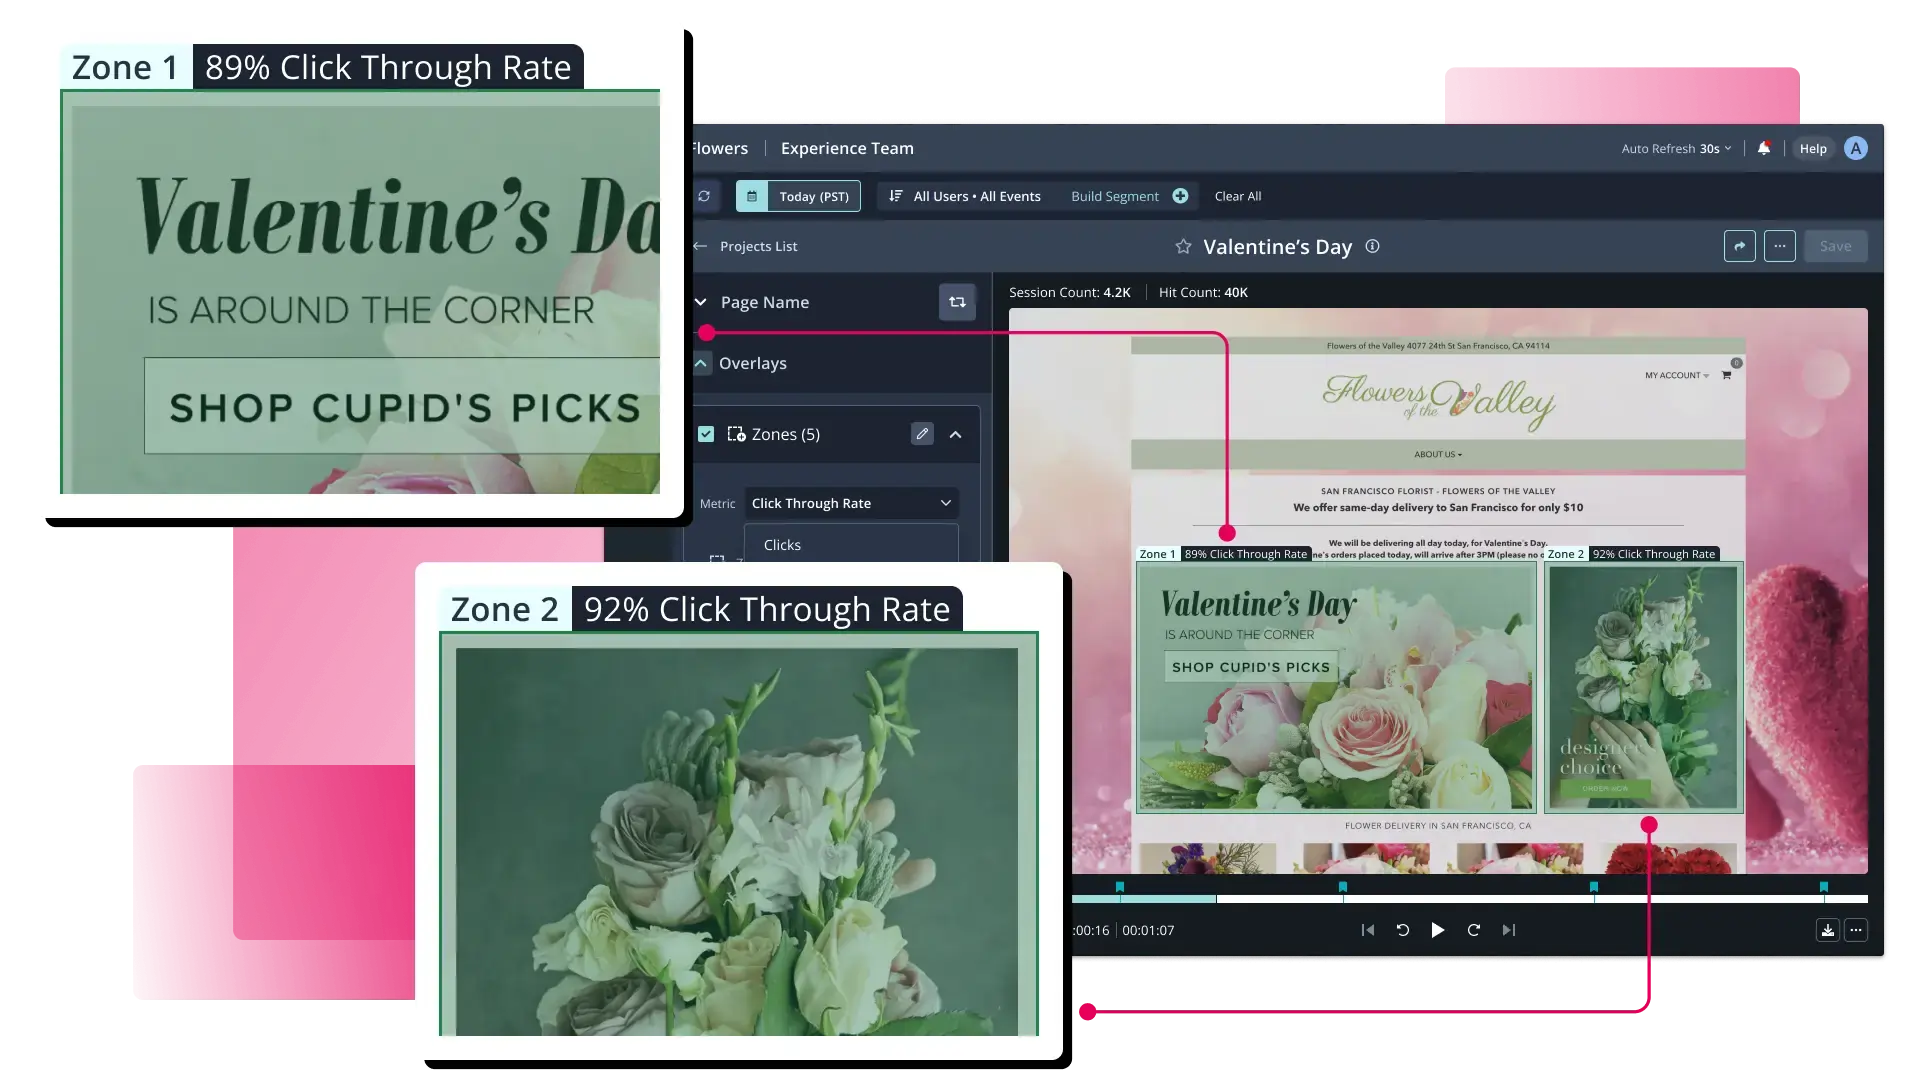
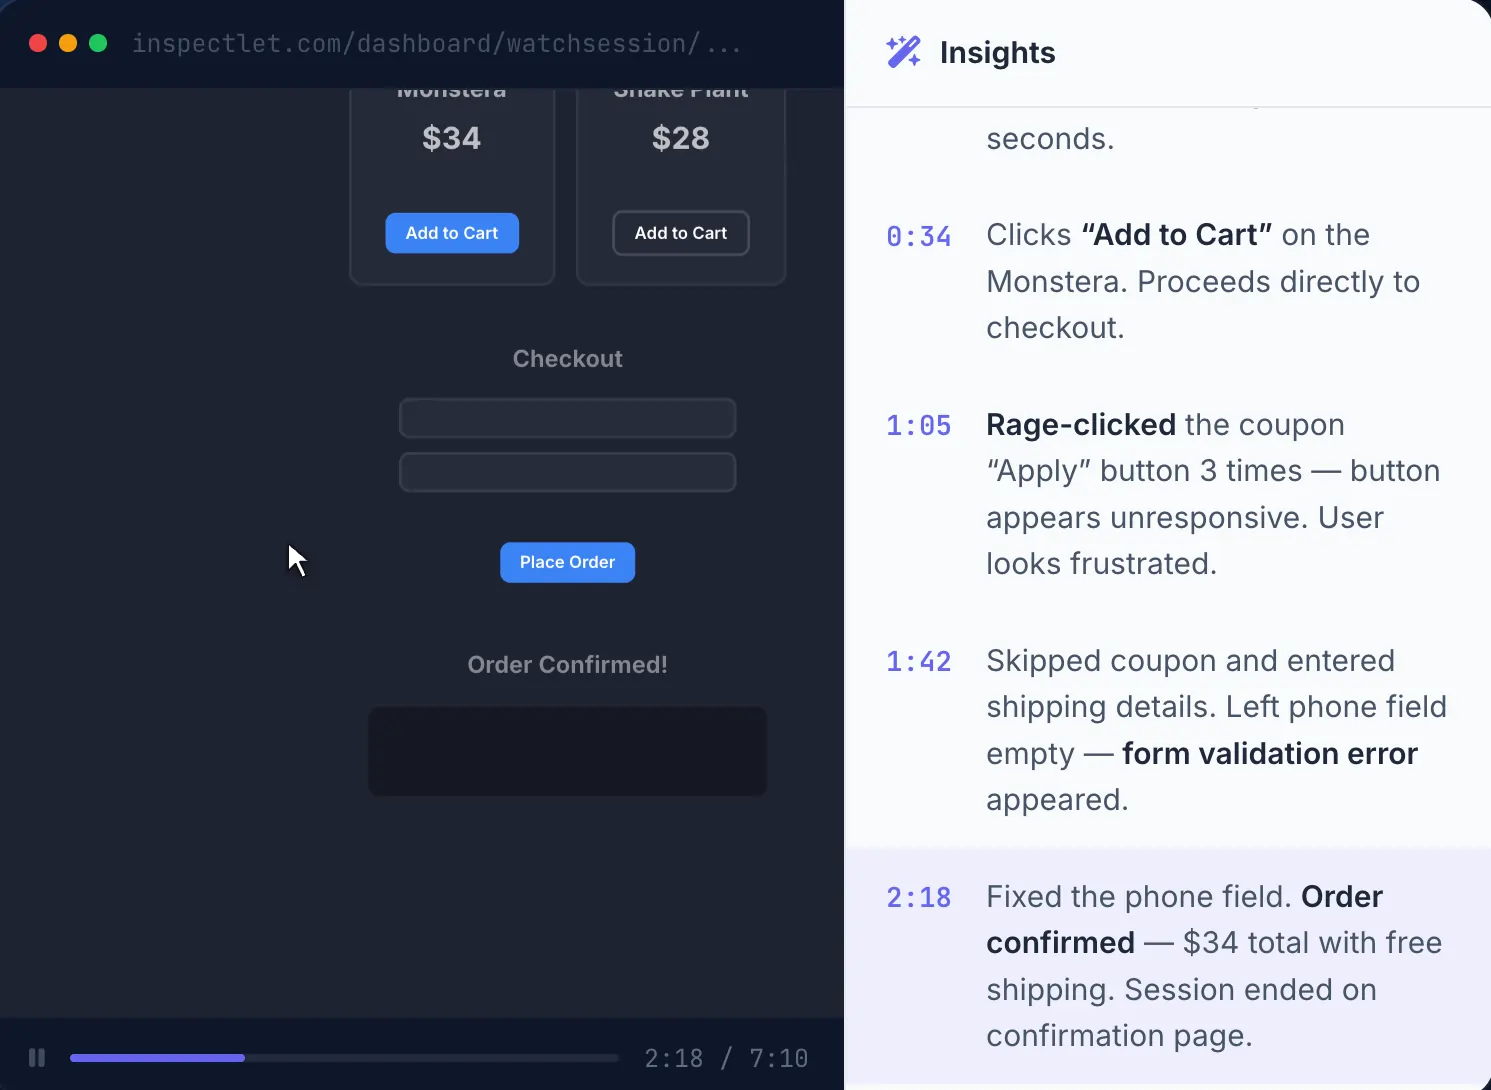
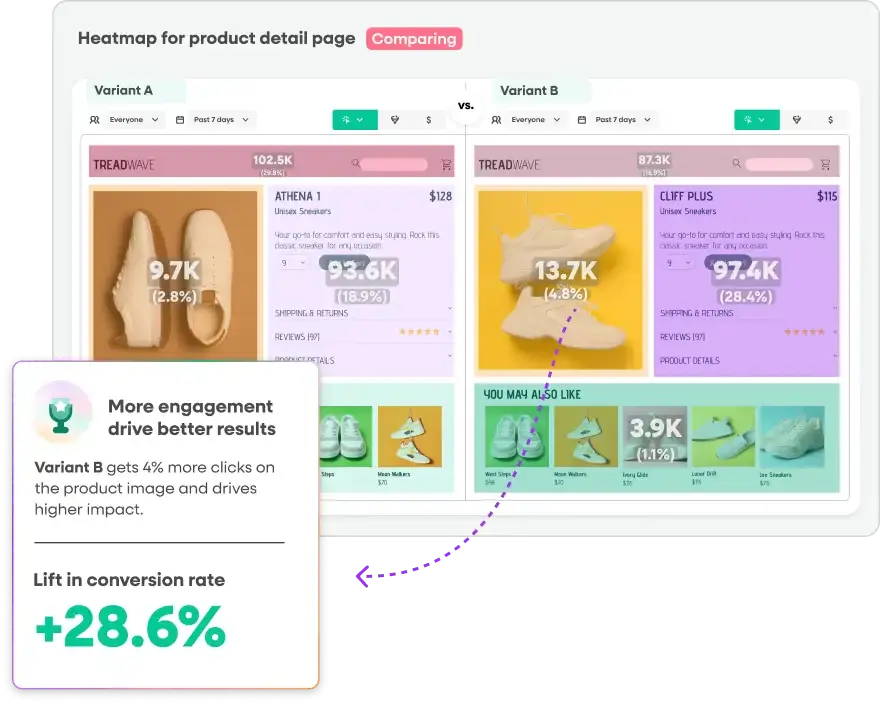
Convert Experiences has positioned itself as the premier choice for conversion teams who prioritize workflow efficiency. By embedding native heatmaps directly into its A/B testing platform, Convert allows researchers to view behavioral data per experiment variation. A standout feature is "Convert Signals®," a frustration detection layer that automatically flags sessions involving rage clicks, dead clicks, or scroll stalls. This prevents teams from having to manually review thousands of hours of session recordings, instead surfacing the specific moments where the user experience breaks down.
2. Glassbox: Enterprise-Grade Journey Mapping
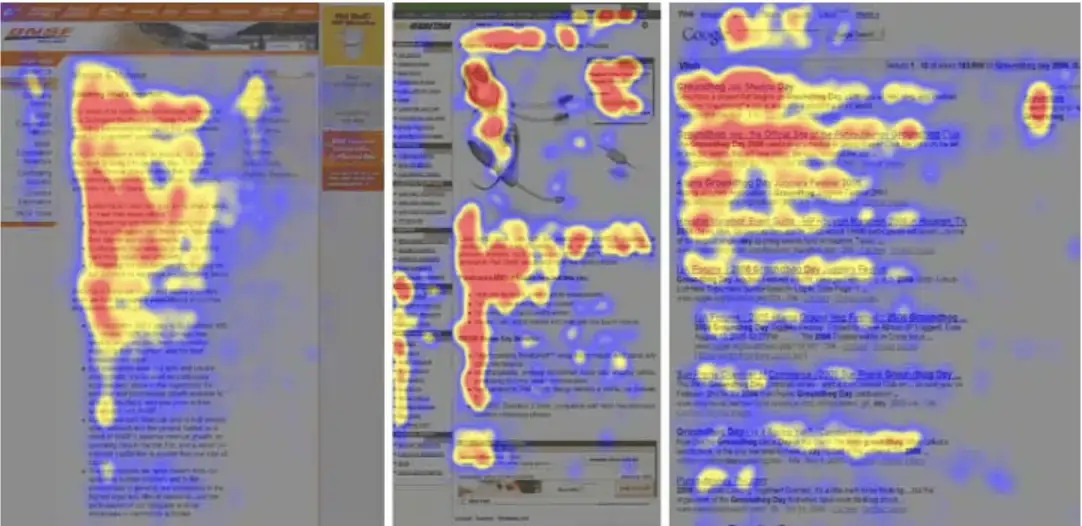
Glassbox caters to large-scale enterprises with complex conversion funnels. Its primary strength lies in its "tagless" capture technology, which records every digital interaction without requiring manual setup for specific events. The platform is particularly adept at identifying technical backend errors that coincide with UI friction, providing a holistic view of the user journey from both a performance and a design perspective.
3. Quantum Metric: Quantifying Digital Frustration
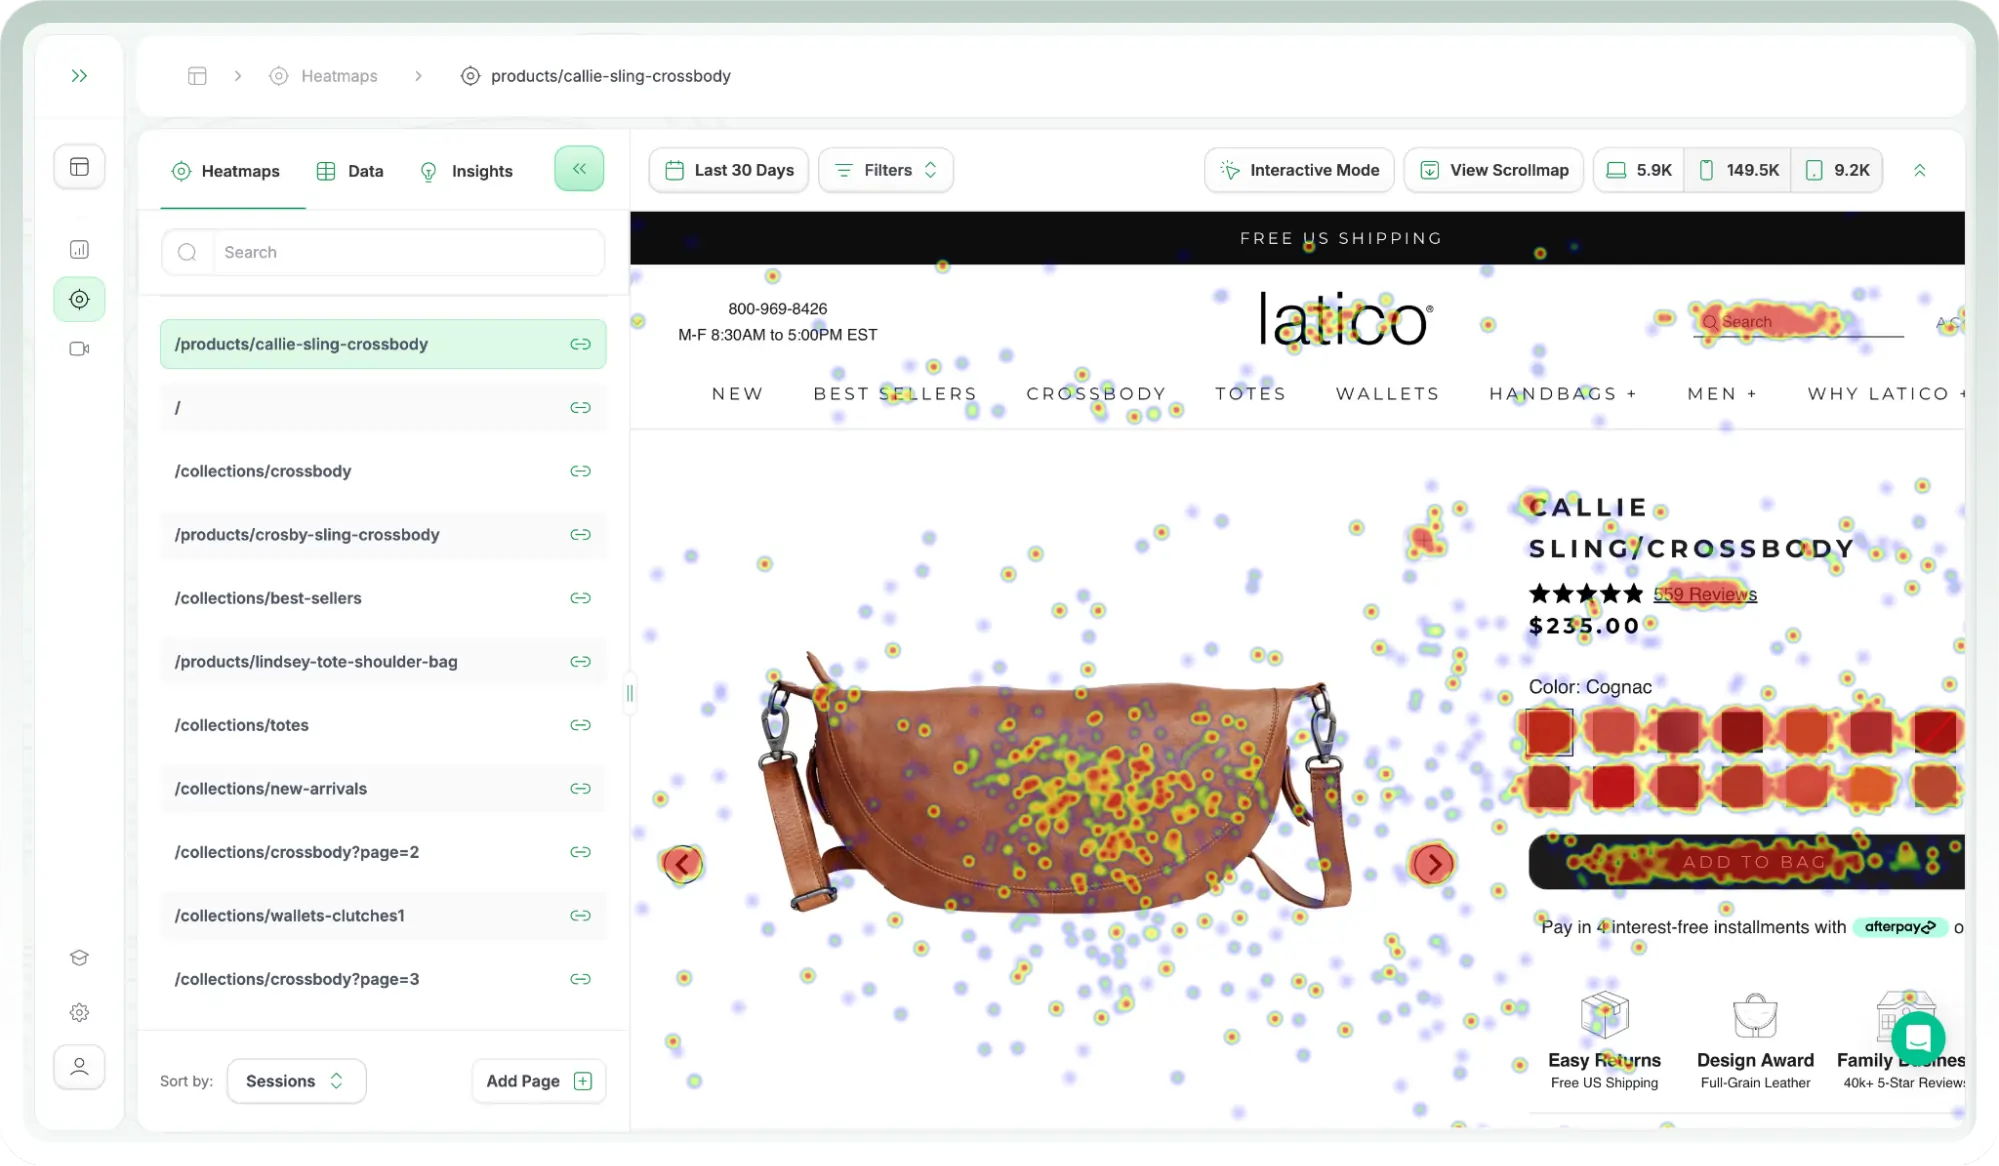
Quantum Metric focuses on the financial impact of user experience. Its "Felix AI" feature summarizes behavioral data to highlight the most significant opportunities for revenue growth. By capturing over 300 out-of-the-box metrics, Quantum Metric allows e-commerce teams to see exactly where technical glitches—such as API slowness or render delays—intercept the customer’s path to purchase.
4. Microsoft Clarity: Democratizing Behavioral Data
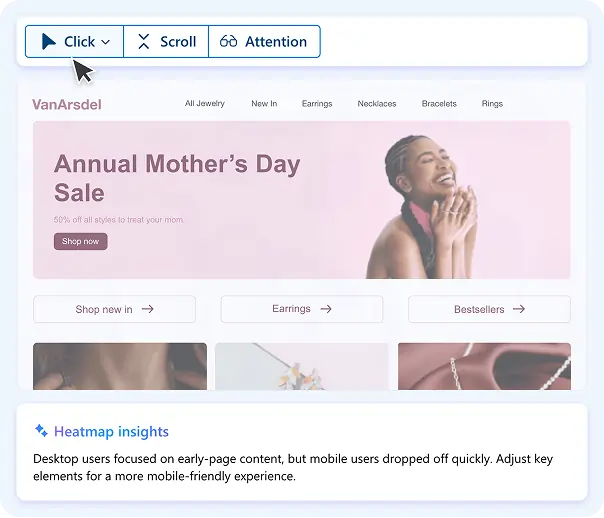
As a free-to-use tool, Microsoft Clarity has disrupted the market by offering robust heatmaps and session recordings without traffic limits. It is an ideal solution for small to medium-sized businesses and e-commerce specialists working with limited budgets. Despite being free, it offers sophisticated features like "rage click" detection and seamless integration with the broader Microsoft and Google ecosystems.
5. Heatmap.com: The Revenue-First Approach
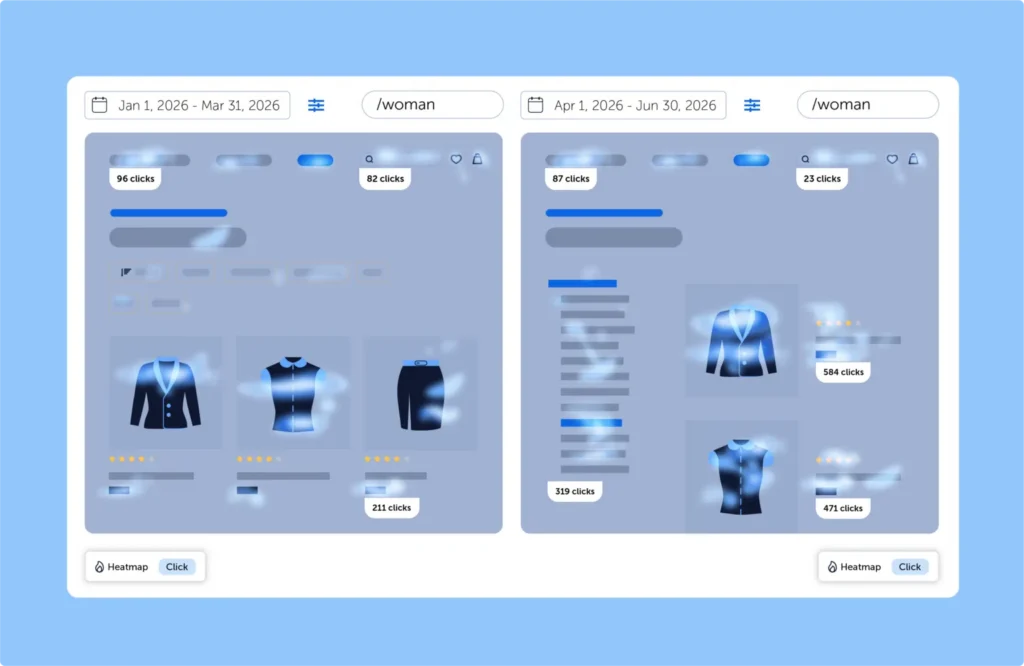
Unlike traditional tools that focus on click density, Heatmap.com attributes actual revenue to specific on-page elements. For Direct-to-Consumer (DTC) brands, this means moving beyond "engagement" to "profitability." The tool’s Revenue Per Session (RPS) metric allows marketers to see which product blocks or call-to-action (CTA) buttons are actually driving sales, rather than just attracting idle clicks.
6. Contentsquare (Incorporating Hotjar): The Market Leader
In a significant industry consolidation finalized in mid-2025, Hotjar’s suite of tools was fully integrated into the Contentsquare Group. This merger combined Hotjar’s accessibility and user-friendly interface with Contentsquare’s advanced predictive analytics. The resulting platform offers a comprehensive toolkit for everything from scrappy marketing audits to deep-dive product management research.
Strategic Categorization and Pricing Models
| Product | Starting Price (Billed Annually) | Free Trial | Core Value Proposition |
|---|---|---|---|
| Convert Experiences | $299/mo | 15 Days | Integrated A/B testing + Frustration detection |
| Microsoft Clarity | Free | N/A | Unlimited traffic tracking at no cost |
| Heatmap.com | $20/mo | 14 Days | Revenue-attribution for every click |
| Lucky Orange | $32/mo | 7 Days | Dynamic heatmaps for e-commerce stores |
| Crazy Egg | $29/mo | 14 Days | High-speed visualization and click segmenting |
| Mouseflow | $25/mo | 14 Days | Friction detection and funnel analytics |
| VWO Insights | Contact Sales | 30 Days | Comprehensive research for UX professionals |
The Technical Mechanics of Heatmap Generation
To understand the value of these tools, one must understand the data collection process. Most modern heatmap tools utilize a lightweight JavaScript snippet. This script records "event listeners" for various browser actions:
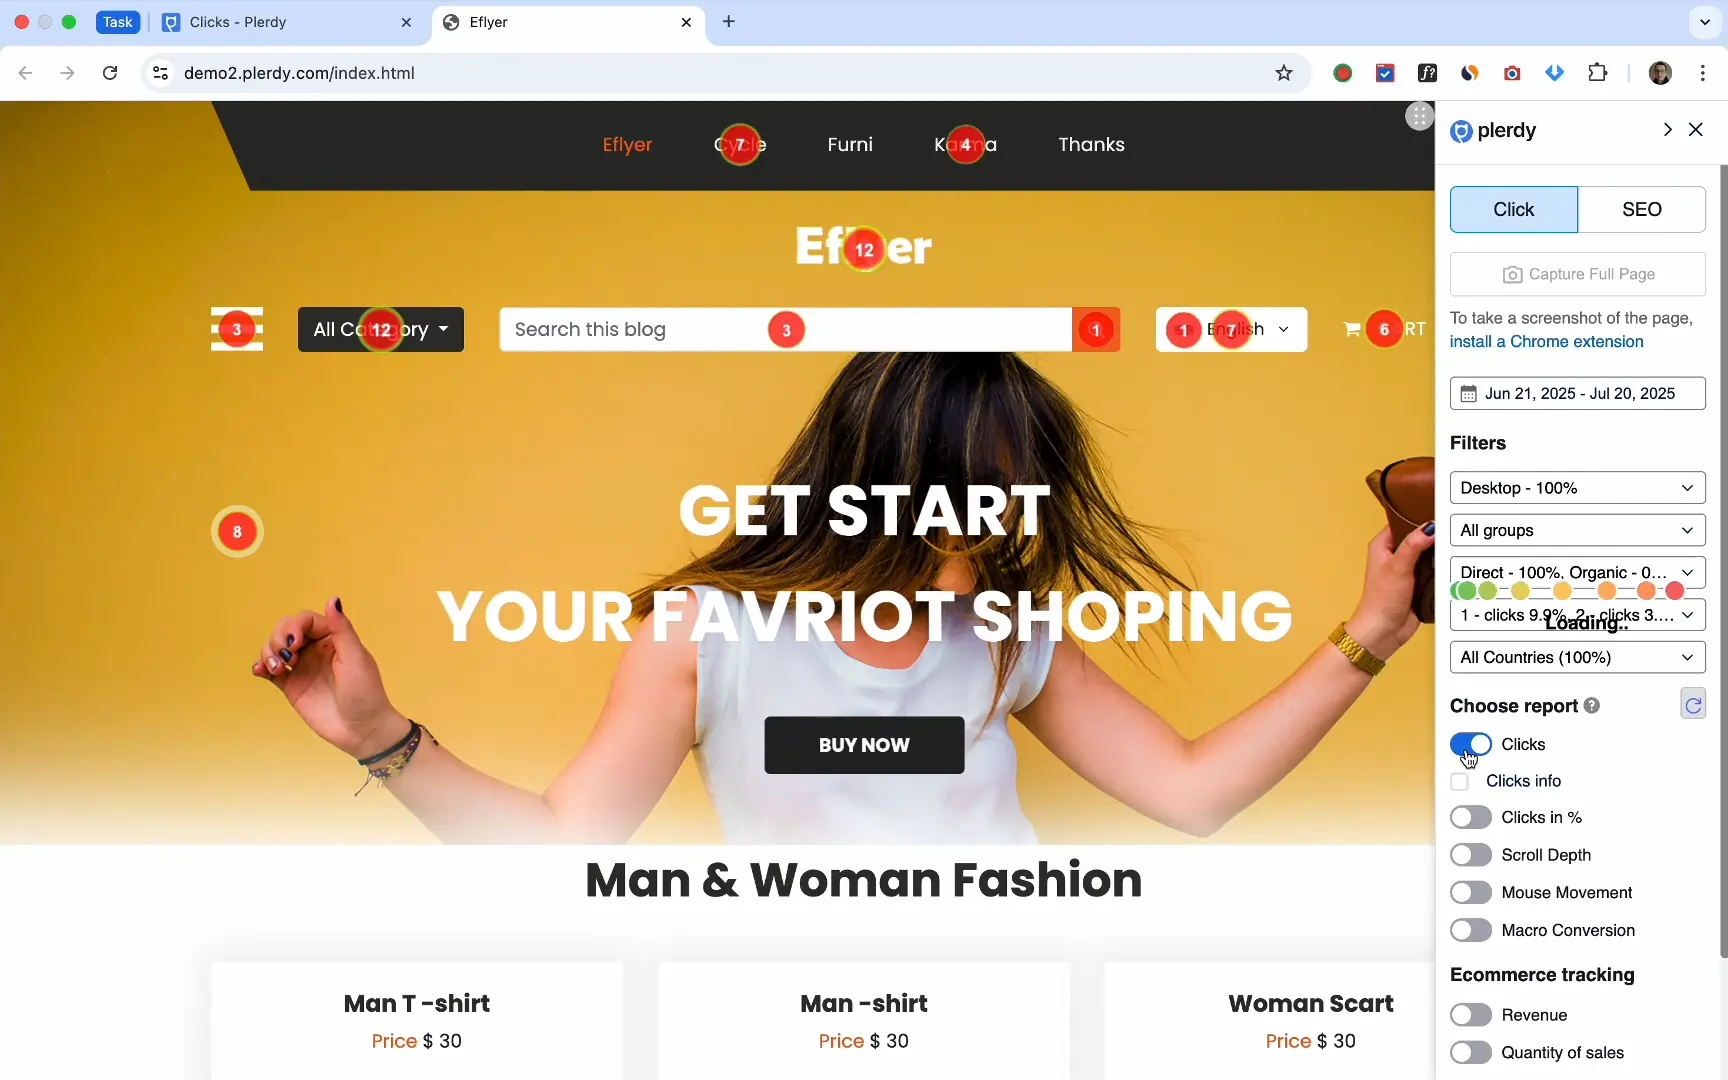
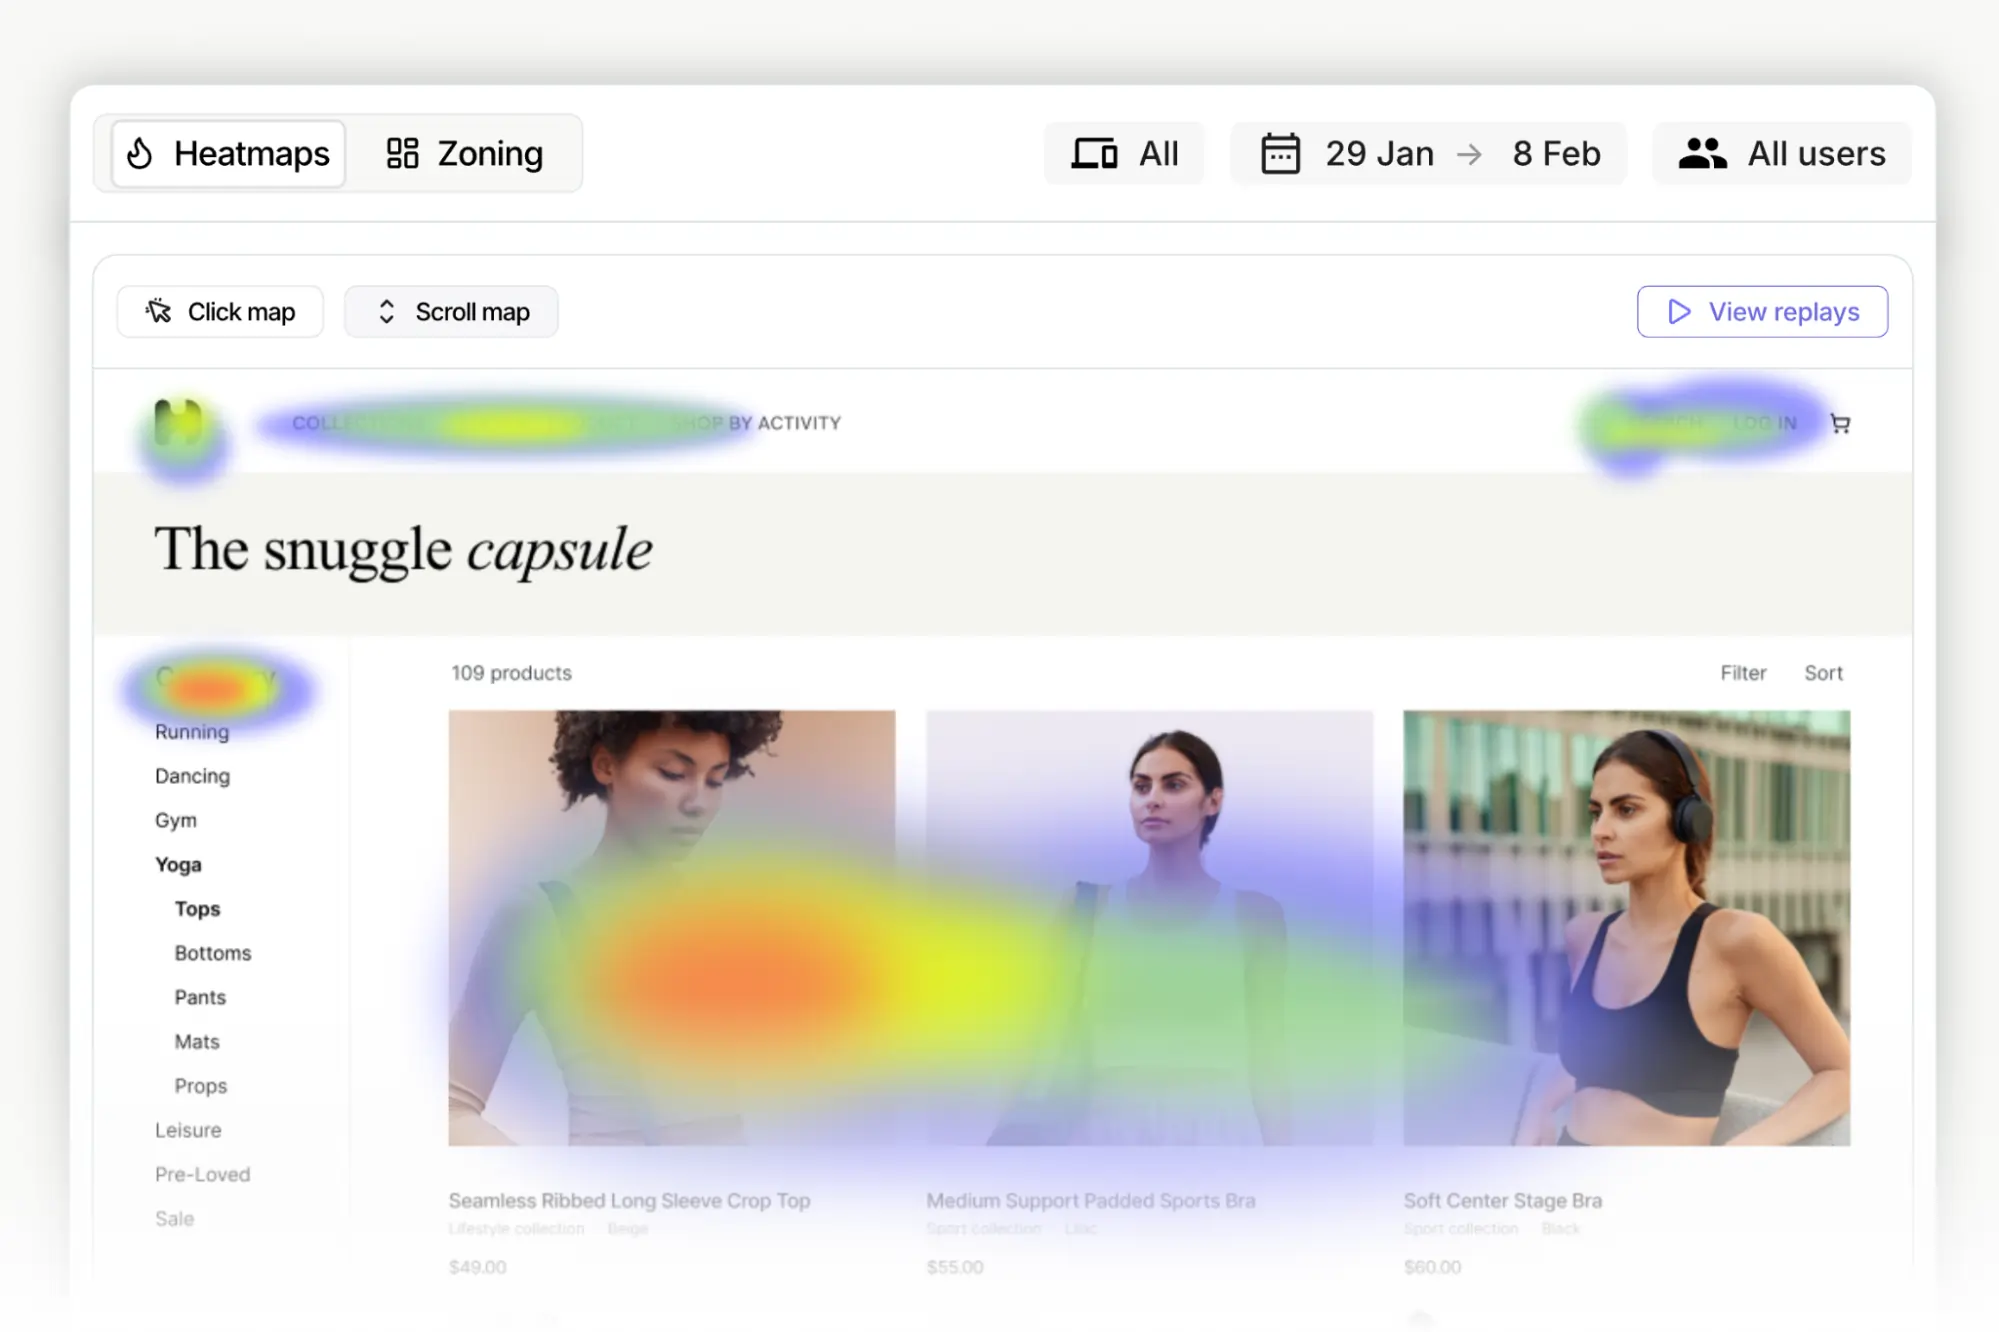
- Click Maps: These aggregate every click (or tap on mobile) to show which links, buttons, and images are attracting the most attention. They often reveal "dead clicks"—instances where users click on non-linked elements, signaling a design flaw.
- Scroll Maps: These show the percentage of users who reach specific depths of a page. This is critical for determining the optimal placement of primary CTAs and important information.
- Move Maps (Hover Maps): These track mouse movement, which industry research suggests has an 84% to 88% correlation with eye movement. This provides a proxy for visual attention.
Chronology of the 2024-2025 Optimization Shift
The last 18 months have seen a fundamental shift in how visual analytics are utilized.
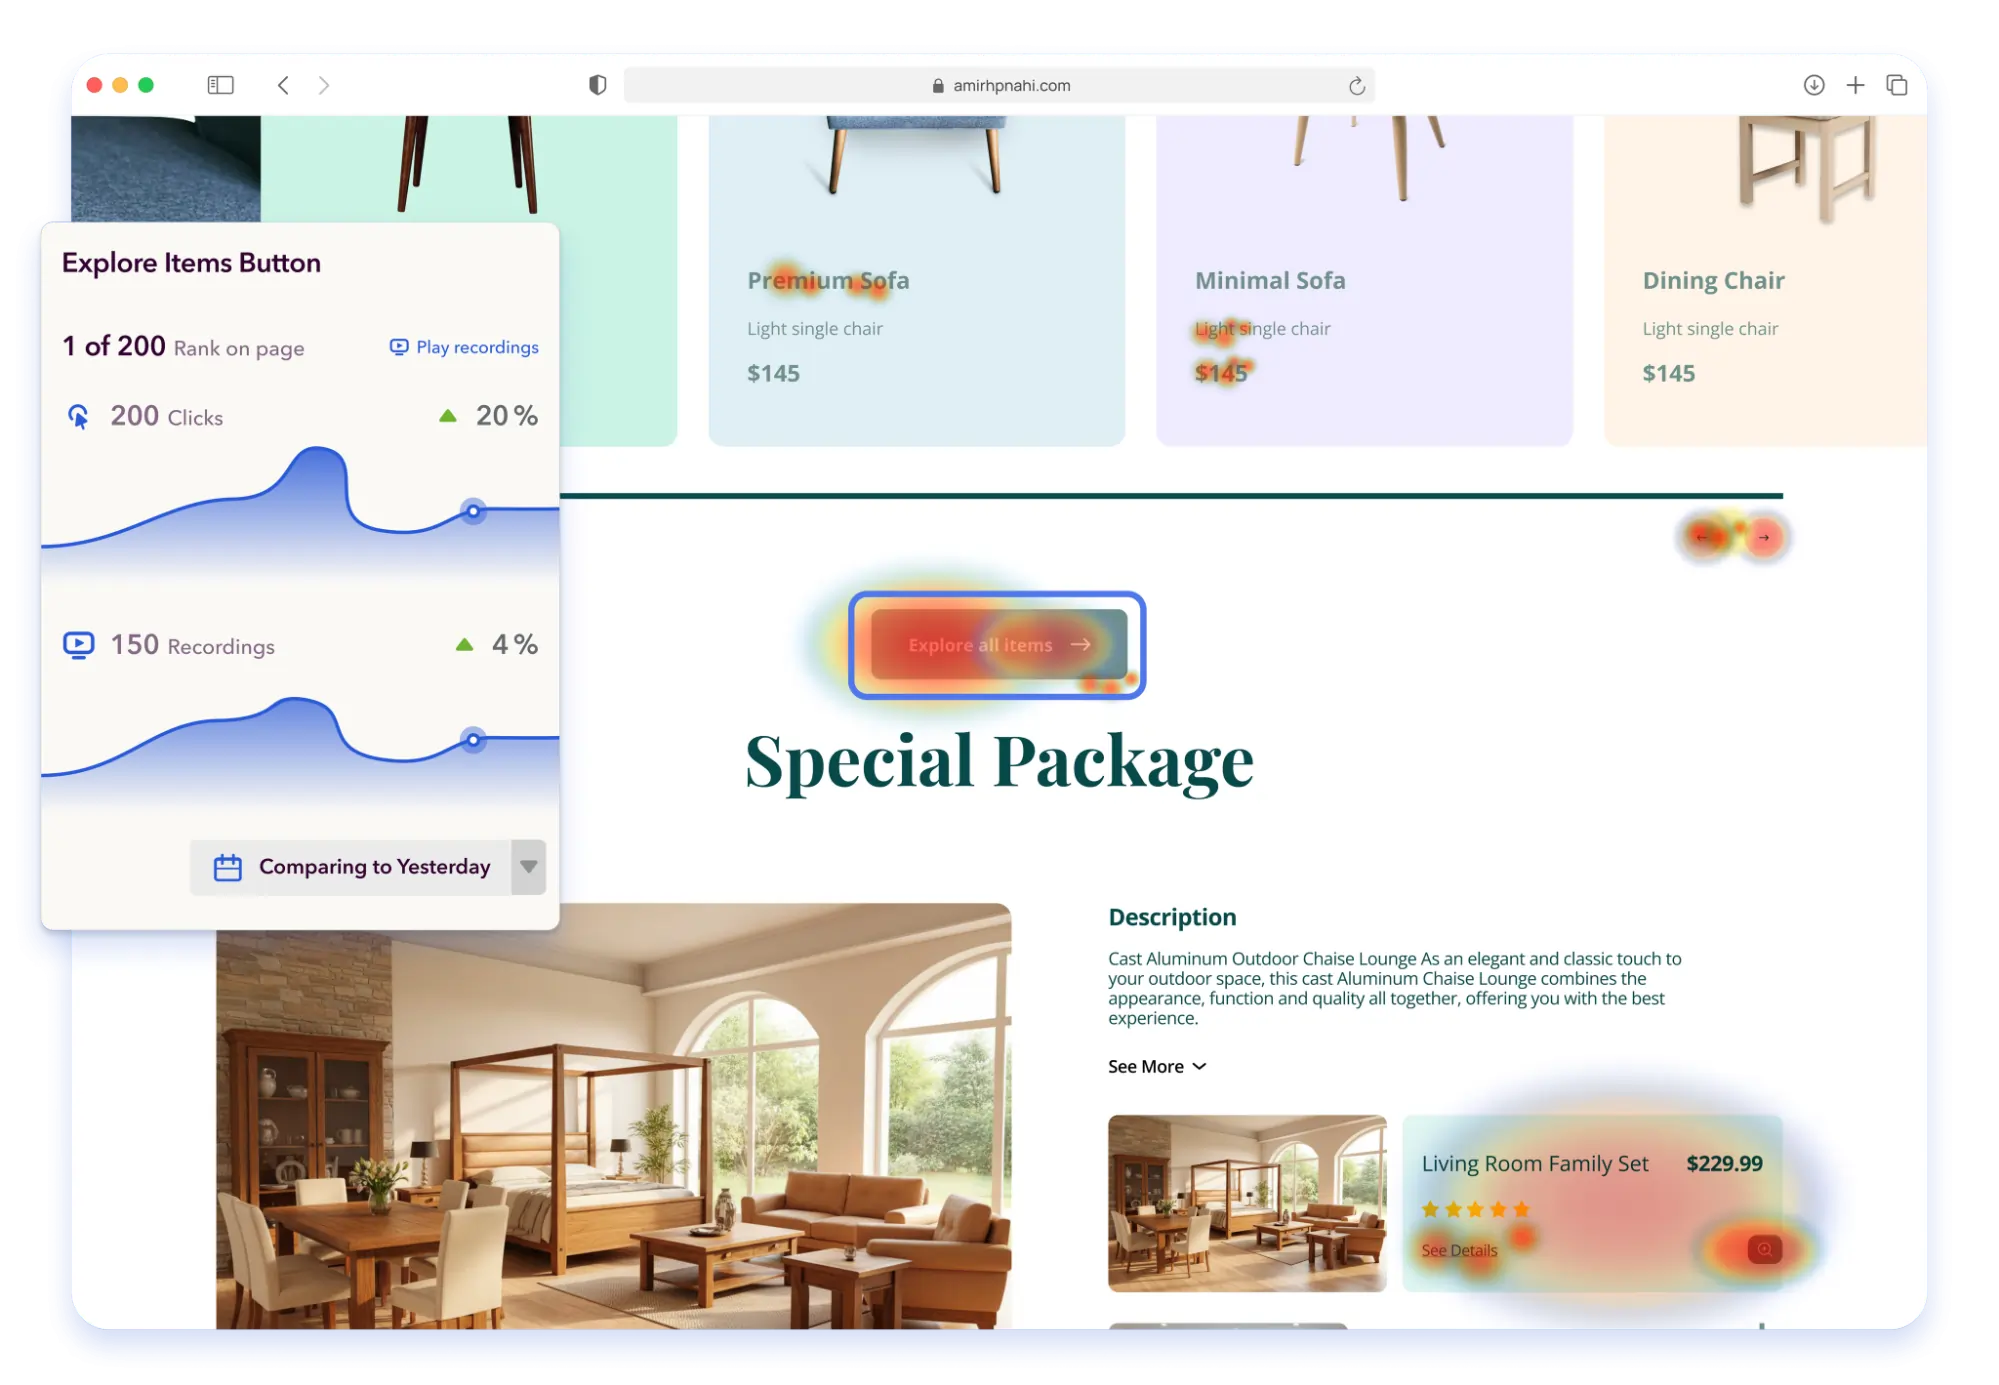
- Early 2024: The rise of AI-powered "frustration signals" became standard. Tools began moving away from raw data toward "insight-ready" reports.
- Late 2024: Privacy-first tracking became the industry norm. Tools like VWO and Convert Experiences enhanced their PII (Personally Identifiable Information) masking to comply with tightening GDPR and CCPA regulations.
- Mid-2025: The full integration of Hotjar into Contentsquare marked the end of the "standalone" heatmap era, as most tools now offer a full behavioral suite including surveys, funnels, and session replays.
Industry Implications: Beyond the Click
The implications of heatmap data extend into every department of a digital organization. For designers, heatmaps provide the objective evidence needed to move past "subjective aesthetics." For product managers, these tools validate whether new features are being discovered or ignored.
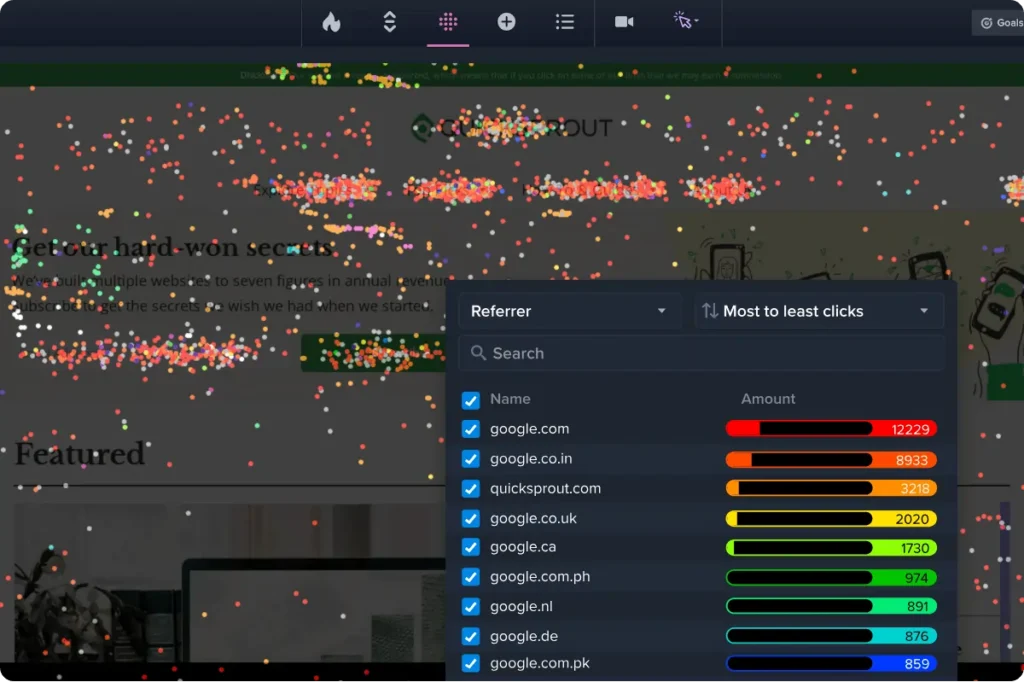
Furthermore, the integration of AI has changed the speed of optimization. AI models can now analyze thousands of session recordings and heatmaps simultaneously to provide a "UX Health Score." This allows teams to prioritize fixes based on the severity of the friction detected rather than the order in which it was reported.
Privacy and Ethics in User Tracking
As tracking technology becomes more sophisticated, the ethical implications have come under scrutiny. Leading heatmap providers have responded by implementing "Privacy by Design." Modern tools do not record keystrokes in sensitive fields (like credit card numbers or passwords) and offer robust data anonymization. For organizations operating in the EU or California, selecting a tool with localized data residency and clear compliance certifications is no longer optional—it is a legal necessity.
Conclusion and Future Outlook
Heatmap tools have evolved from simple visualization scripts into complex behavioral engines that drive the modern digital economy. In 2025, the most successful brands are those that treat user experience as a continuous experiment rather than a static project.

Whether an organization chooses the revenue-centric approach of Heatmap.com, the integrated testing power of Convert Experiences, or the comprehensive free features of Microsoft Clarity, the objective remains the same: to see the world through the user’s eyes. As AI continues to refine these insights, the gap between what users want and what websites provide will continue to shrink, leading to a more efficient, user-friendly, and profitable internet. For any business looking to survive the competitive landscape of the late 2020s, the adoption of a sophisticated visual analytics tool is not just an advantage—it is a prerequisite for growth.