The field of digital marketing currently stands at a crossroads where the promise of scientific precision often clashes with the reality of outdated statistical methodologies. While A/B testing is frequently championed as the pinnacle of evidence-based decision-making—utilizing randomized controlled trials similar to those found in clinical medicine, genetics, and physics—the actual implementation of these tests in the corporate world remains significantly behind the curve. Experts argue that the common practices utilized by the majority of practitioners are lagging by nearly half a century compared to modern statistical approaches. This gap has created a systemic issue within Conversion Rate Optimization (CRO), where "data-driven" decisions are frequently based on illusory findings, inflated lift figures, and a fundamental misunderstanding of error probabilities.
At the heart of this crisis are three primary structural failures: the widespread misuse of statistical significance tests, a chronic lack of consideration for statistical power, and the inherent inefficiency of classical fixed-sample testing when applied to the fast-moving digital environment. To address these deficiencies, a new framework known as the AGILE statistical approach has emerged. Drawing inspiration from the rigorous protocols of clinical trials, this methodology seeks to align the mathematical requirements of experimentation with the operational realities of modern business.
The Pitfall of Data Peeking and the Significance Crisis
The most prevalent error in contemporary A/B testing is the misuse of classical significance tests, such as the Student’s T-test. In a standard laboratory setting, these tests require a fixed sample size to be determined before the experiment begins. The mathematical integrity of the p-value—the probability of observing a result by chance—depends entirely on the researcher performing a single evaluation at the end of the pre-specified period.
However, the reality of the digital dashboard contradicts this requirement. Marketing teams, stakeholders, and executives often monitor live data daily. This practice, known as "data peeking" or data-driven optional stopping, creates a phenomenon where the reported error rate is significantly lower than the actual error rate. If a practitioner looks at a test multiple times and stops the experiment the moment a "significant" result appears, they are effectively gaming the system.
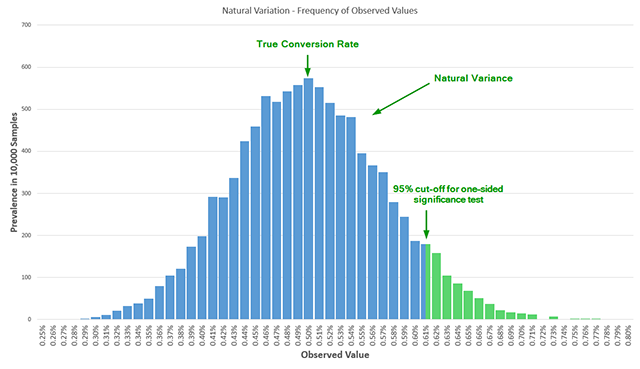
Statistical data indicates that peeking just twice results in more than double the actual error rate compared to the nominal reported error. If a team peeks ten times during a test’s duration, the actual probability of a false positive can be five times higher than what the software reports. This leads to a "Garbage In, Garbage Out" (GIGO) cycle where companies implement changes believed to be winners, only to see no actual improvement in long-term revenue because the initial "lift" was merely a result of natural variance in a Bernoulli distribution.
The Invisible Variable: Understanding Statistical Power
While significance (Type I error) receives most of the attention in marketing literature, statistical power (Type II error) is often entirely ignored. Statistical power, or "test sensitivity," represents the probability that a test will detect a true effect if one actually exists. Without adequate power, a test is essentially blind to smaller, yet still valuable, improvements in conversion rates.
A review of influential A/B testing literature published between 2008 and 2014 revealed a staggering trend: out of seven major books on the subject, only one mentioned statistical power in the correct context, and even then, only superficially. This lack of awareness has led to the proliferation of under-powered tests. When a test is under-powered, a variant that is truly superior may fail to reach significance, leading the team to discard a winning idea. These "false negatives" are particularly damaging because they often discourage further exploration in a specific strategic direction, effectively closing the door on potential growth.
The relationship between power and sample size is rigid. To increase power, one must increase the number of users in the test. Many free online calculators operate at a default power of 50%, which is equivalent to a coin toss. For a test to be considered robust by scientific standards, a power of 80% or 90% is typically required. For many businesses, reaching the sample sizes necessary for this level of sensitivity can take weeks or months, creating a tension between statistical rigor and the need for organizational agility.
A Chronology of Experimental Evolution
To understand why A/B testing is currently struggling, it is necessary to look at the timeline of experimental design. The foundations of the tests used today were largely laid by Ronald A. Fisher and others in the early 20th century for use in agriculture and biology.
- 1920s–1930s: Development of classical frequentist statistics and the concept of the "null hypothesis." These were designed for experiments where data collection was slow and results were analyzed only once (e.g., at the end of a harvest).
- 1960s–1970s: Medical researchers realized that fixed-sample tests were unethical in clinical trials. If a new drug was clearly saving lives, it was wrong to continue the trial until the end. This led to the development of "Group Sequential Design," allowing for interim analysis.
- 2000s: The birth of web analytics. Early tools brought Fisher’s 1920s math to the digital world, but without the strict controls required by laboratory settings.
- 2010s: The "Explosion of CRO." A/B testing became a standard business practice, but the focus shifted toward ease of use rather than mathematical accuracy, leading to the "peeking" crisis.
- Present Day: The emergence of the AGILE method and Bayesian alternatives, attempting to reconcile the need for interim monitoring with the requirement for error control.
The AGILE Statistical Method: A Clinical Solution for Marketing
The AGILE statistical method was developed specifically to bridge the gap between the rigid requirements of classical statistics and the fluid nature of digital marketing. By adopting "error-spending functions" from the medical field, AGILE allows practitioners to perform interim analyses—peeking at the data—without inflating the false positive rate.
The AGILE framework introduces several critical components to the testing workflow:
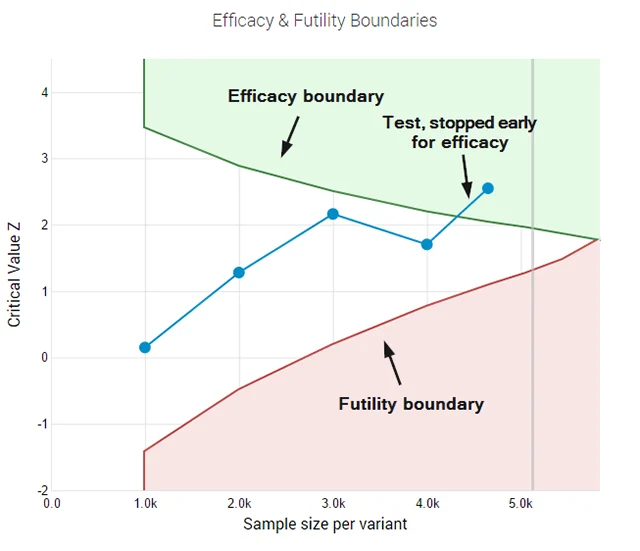
- Interim Analysis with Controlled Error: Instead of waiting for a fixed end date, the AGILE method calculates "alpha-spending" at various intervals. This means the threshold for significance is adjusted based on how many times the data has been analyzed, ensuring that the final 95% confidence level remains legitimate.
- Futility Stopping Rules: One of the most significant efficiency gains in the AGILE method is the ability to stop a test that is clearly failing. If a variant shows a high probability of being a "loser" early on, the test can be terminated for futility. This allows teams to "fail fast," saving time and traffic that can be redirected to more promising experiments.
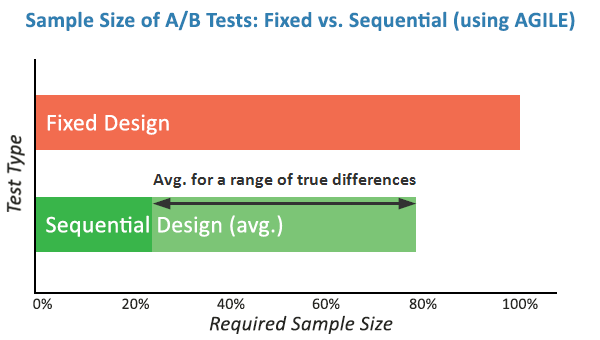
- Efficiency Gains: Simulations have shown that the AGILE approach can offer efficiency gains of 20% to 80% in terms of sample size. If a variant has a massive positive impact, the AGILE method will likely detect it much sooner than a fixed-sample test, allowing for quicker implementation and faster realization of revenue.
Industry Implications and Expert Analysis
The shift toward more robust statistical models like AGILE has profound implications for the Return on Investment (ROI) of marketing departments. Analysts suggest that the "illusion of success" created by poor statistical practices has historically led to bloated expectations. When companies report "20% lifts" in every test but see flat annual revenue, the discrepancy is almost always found in the testing methodology.
Data scientists argue that the adoption of AGILE-like frameworks will lead to a "quality over quantity" shift in testing. While it may become harder to achieve a "winning" result due to more stringent controls, the results that do pass the threshold will be genuine and reproducible. This builds trust between data teams and executive leadership, as the projected gains from A/B tests begin to align more closely with actual financial performance.
Furthermore, the implementation of futility rules changes the culture of experimentation. Rather than viewing a "null" result as a failure of the test, it is viewed as a successful preservation of resources. In an environment where only 10% to 20% of A/B tests typically yield a positive result, the ability to quickly discard the other 80% is a major competitive advantage.
Conclusion: Toward a More Scientific Future
The transition from classical, misused statistical tests to the AGILE method represents the professionalization of the CRO industry. As digital markets become more saturated and the cost of traffic continues to rise, the margin for error in decision-making narrows. Businesses can no longer afford to rely on "garbage" data derived from flawed experimental designs.
By incorporating the lessons learned from decades of clinical research, the AGILE method provides a roadmap for a truly scientific approach to digital marketing. It offers the flexibility that practitioners demand—the ability to look at data, stop tests early, and pivot quickly—without sacrificing the mathematical integrity that makes testing valuable in the first place. For organizations willing to invest in these more sophisticated methods, the reward is a clearer view of customer behavior and a more predictable path to growth.