rifanmuazin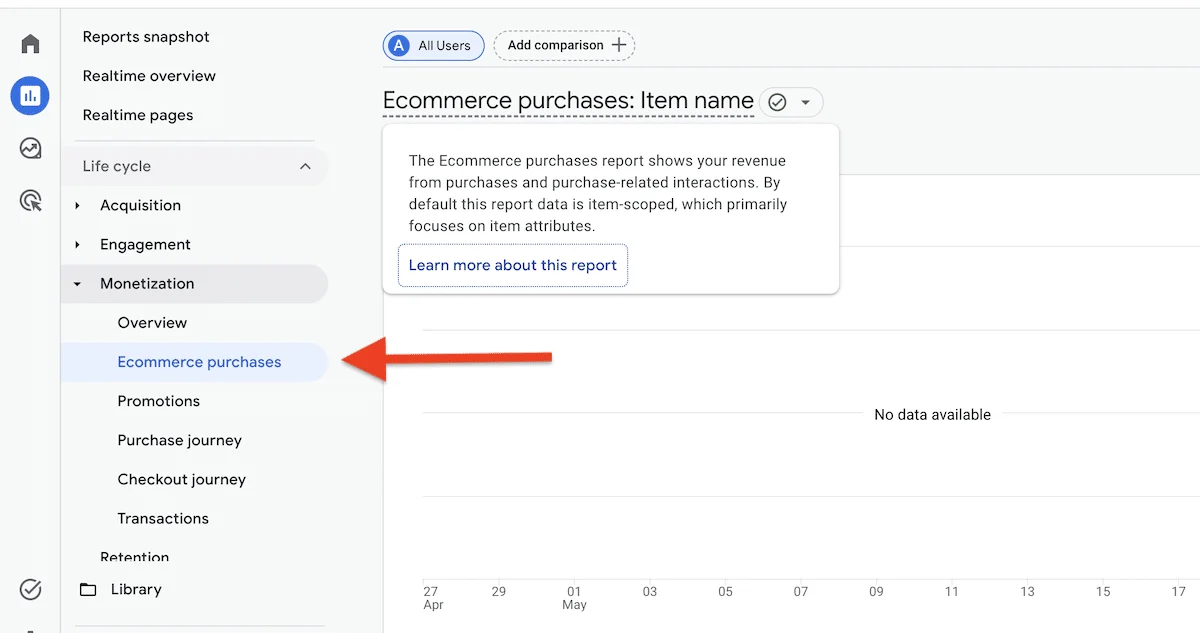
Conversion rate optimization (CRO) key performance indicators (KPIs) represent the foundational metrics used by digital strategists to determine whether iterative changes to a website translate into tangible business growth. In an era where digital acquisition costs are rising, the ability to discern which site modifications—ranging from headline adjustments to checkout redesigns—actually contribute to the bottom line has become a competitive necessity. These KPIs serve as the bridge between user experience (UX) data and executive-level financial reporting, answering critical questions regarding purchase behavior, lead quality, and customer acquisition efficiency.
To be considered effective, a CRO KPI must satisfy three primary criteria: it must be measurable, it must be directly influenced by website changes, and it must correlate with a specific business objective. Without these parameters, organizations risk falling into the trap of tracking “vanity metrics” that show activity without indicating progress toward profitability.
The Critical Distinction Between CRO Metrics and KPIs
A common point of confusion within marketing departments is the distinction between a metric and a KPI. While the terms are often used interchangeably, their roles in a data-driven strategy are vastly different. A metric is any data point that tracks user behavior on a website, such as scroll depth, clicks, or pageviews. These are essential for diagnosing problems and understanding the “how” and “where” of user movement.
Conversely, a KPI is a specific subset of metrics that measures the outcome of an action in relation to a business goal. If an organization’s objective is to increase annual recurring revenue (ARR), a metric like “button clicks” is insufficient. Instead, the KPI would be the “trial-to-paid conversion rate.” While metrics help spot behavior—identifying where users drop off or which elements they interact with—KPIs judge the efficacy of a page redesign or an A/B test.
The following table summarizes the functional differences between these two data categories:
| Feature | CRO Metrics | CRO KPIs |
|---|---|---|
| Purpose | Understanding visitor behavior | Judging business goal improvement |
| Focus | Identifying actions (clicks, depth) | Measuring outcomes (sales, leads) |
| Examples | Scroll depth, CTA clicks, form starts | Purchase rate, RPV, qualified lead rate |
| Primary Use | Diagnosing technical or UX issues | Validating the success of a test or strategy |
A Chronology of CRO Measurement Evolution
The methodology for tracking digital success has undergone a significant transformation over the last two decades. In the early 2000s, “hits” and “pageviews” were the primary measures of success. However, as the e-commerce landscape matured, the focus shifted toward simple conversion rates.
By the mid-2010s, the rise of sophisticated A/B testing tools allowed marketers to move beyond surface-level data. The introduction of Google Analytics 4 (GA4) in recent years marked a definitive shift from session-based tracking to event-based tracking. This evolution has forced businesses to adopt a more nuanced approach to KPIs, focusing on user journeys across multiple devices rather than isolated sessions. Today, the industry standard has moved toward “Revenue Per Visitor” (RPV) and “Customer Lifetime Value” (CLV) as the ultimate arbiters of CRO success.
Primary KPIs for Revenue and Conversion Tracking
For most commercial entities, the KPIs closest to the final transaction are the most scrutinized. These numbers provide an immediate feedback loop on whether the traffic currently being acquired is being utilized effectively.
1. Conversion Rate (CR)
The conversion rate remains the primary indicator of funnel health. It is calculated by dividing the number of successful conversions by the total number of visitors, then multiplying by 100. For instance, if a landing page receives 10,000 visitors and generates 400 sales, the conversion rate is 4%.
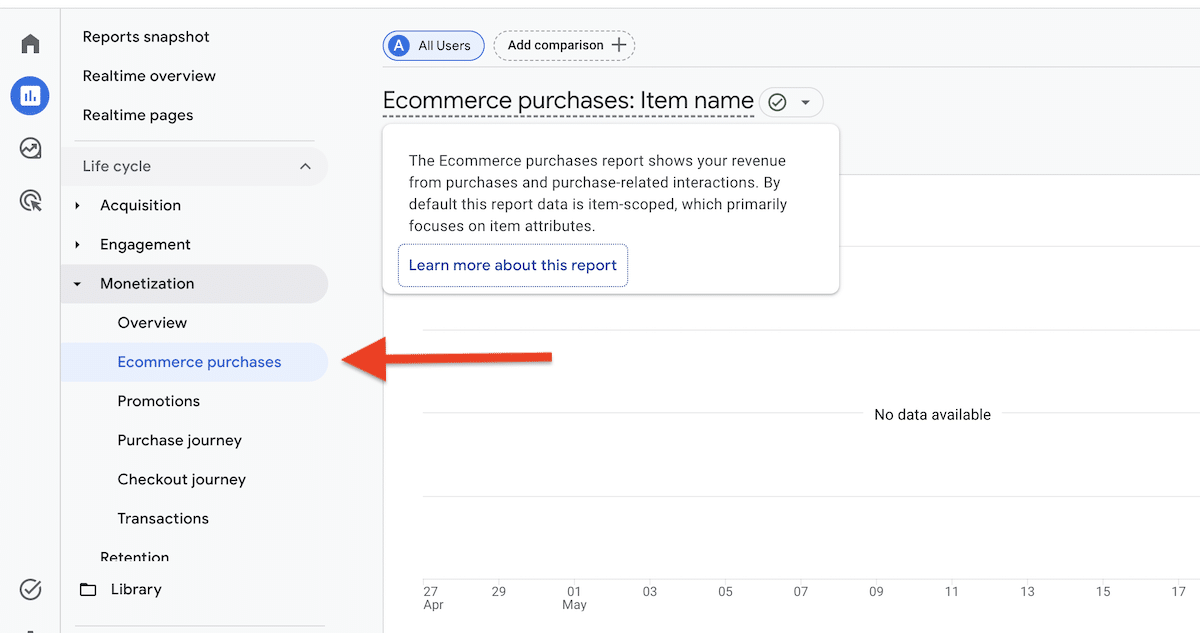
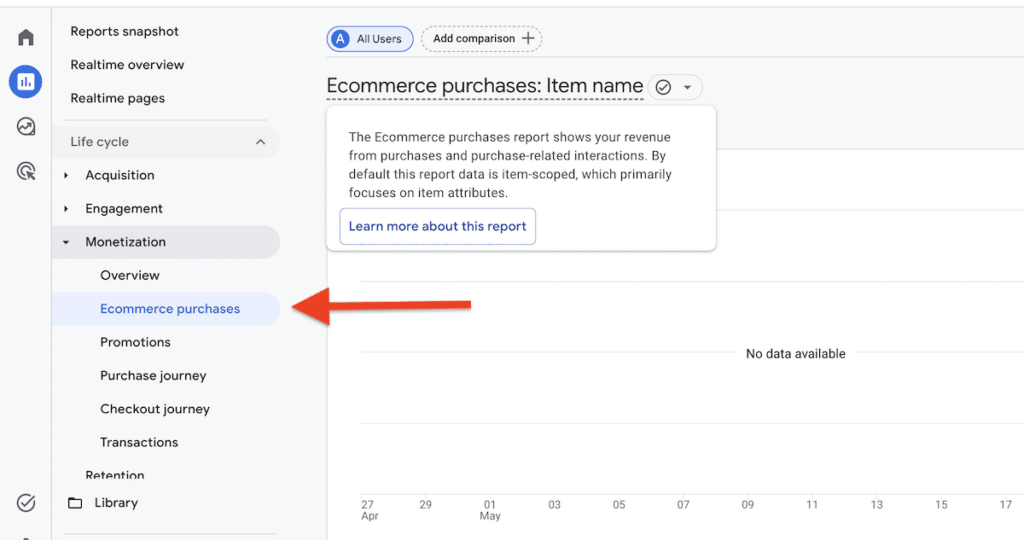
In the modern technical stack, specifically GA4, conversion rates are no longer tracked as a single “goal.” Instead, practitioners must define specific “conversion events.” This allows for more granular tracking, such as distinguishing between a “first-time purchase conversion rate” and a “returning customer conversion rate.”
2. Revenue Per Visitor (RPV)
Industry analysts often argue that RPV is a superior metric to conversion rate because it accounts for the value of the transaction. RPV is calculated by dividing total revenue by total visitors. This KPI is vital because it prevents a common CRO error: increasing the conversion rate by lowering prices, which can inadvertently lead to lower total revenue.
By monitoring RPV, a business can see if a change to the product page—such as adding a “frequently bought together” section—increases the amount of money made from every person who visits the site, regardless of whether the total number of orders increased.
3. Average Order Value (AOV)
AOV measures the average dollar amount spent each time a customer places an order. This KPI is particularly relevant when testing bundles, upsells, and free-shipping thresholds. If a CRO initiative aims to simplify the checkout process, the team must ensure that the ease of purchase does not come at the cost of the customer adding fewer items to their cart.
KPIs for Lead Generation and SaaS Models
For B2B organizations and Software-as-a-Service (SaaS) companies, the transaction is often not a direct sale but a multi-step journey. Here, the KPIs must reflect the quality of the funnel.
4. Qualified Lead Rate
In lead generation, total form submissions can be a misleading metric. A “Qualified Lead Rate” measures the percentage of visitors who not only fill out a form but also meet specific criteria (e.g., company size, budget, or industry) that make them a viable prospect for the sales team.
5. Demo Booking and Trial Signup Rates
For SaaS companies, the “North Star” KPI is often the rate at which visitors move from the marketing site into a product trial or a scheduled demonstration. These metrics are the strongest indicators of whether the value proposition presented on the website resonates with the target audience.
Strategic Framework: Choosing the Right KPI for an Initiative
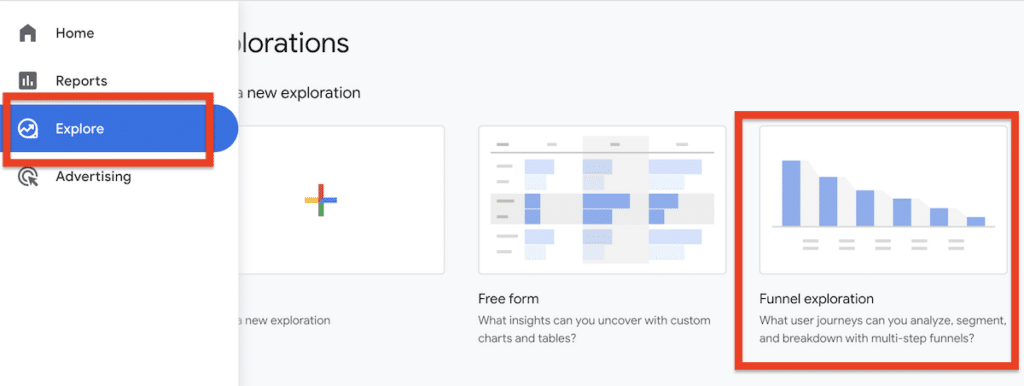
Selecting a KPI requires a structured framework to ensure that the data being tracked is relevant to the specific test being conducted. Industry experts recommend a “Primary, Diagnostic, and Guardrail” approach.
Start with the Business Goal: Every test must be rooted in a high-level objective. If the goal is to “reduce customer acquisition costs,” the primary KPI should be the “conversion rate of paid traffic.”
Identify the Primary KPI: This is the single number that determines if a test is a “winner” or a “loser.” Trying to optimize for five different primary KPIs simultaneously often leads to conflicting data and “analysis paralysis.”
Select Diagnostic KPIs: These are secondary metrics used to explain why the primary KPI moved. If the conversion rate increased, did it happen because more people started the form (form start rate) or because fewer people abandoned the payment page (checkout completion rate)?
Establish Guardrail KPIs: These are “safety” metrics used to ensure that an improvement in one area does not cause damage elsewhere. For example, if you are testing a more aggressive “Add to Cart” pop-up, your primary KPI might be “Add to Cart Rate,” but your guardrail KPI would be “Bounce Rate” or “Customer Satisfaction Score” to ensure you aren’t annoying users away from the site.
The Role of Segmentation in KPI Analysis
Aggregate data frequently hides the truth. A website’s global conversion rate might be 3%, but this figure is often an average of wildly different segments. Professional CRO reporting emphasizes the need to segment KPIs by:
- Device Category: Mobile vs. Desktop behavior often requires different optimization strategies.
- Traffic Source: Users coming from a high-intent search query will convert at a different rate than those from a social media ad.
- User Type: New visitors need trust-building elements, while returning visitors may need a streamlined path to re-purchase.
Reporting CRO KPIs to Executive Leadership
When presenting data to stakeholders, the narrative must move from technical jargon to business impact. Executives are rarely interested in “scroll depth” or “button click-through rates.” Instead, reporting should focus on how CRO initiatives have impacted the “Cost Per Acquisition” (CPA) and “Return on Ad Spend” (ROAS).
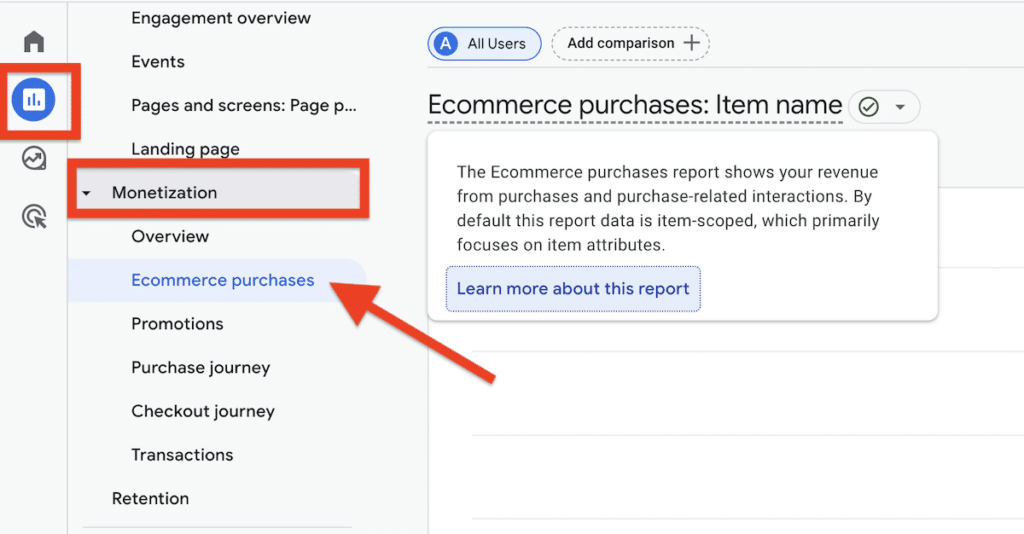
A professional CRO dashboard should present a “before and after” snapshot of the primary KPI, the statistical significance of the results, and the projected annual revenue impact of the change. This approach shifts the perception of CRO from a “marketing expense” to a “profit center.”
Broader Implications and Future Trends
As artificial intelligence and machine learning become integrated into analytics platforms, the future of CRO KPIs lies in predictive modeling. Rather than looking solely at historical data (what happened), businesses are beginning to track “Predictive Conversion Scores” (what is likely to happen).
Furthermore, the increasing focus on data privacy and the phasing out of third-party cookies have made first-party data collection a critical component of CRO. KPIs that measure the “logged-in user rate” or “email capture rate” are becoming more important as they allow businesses to build direct relationships with their audience, reducing reliance on external advertising platforms.
In conclusion, CRO KPIs are not merely numbers on a spreadsheet; they are the vital signs of a digital business. By aligning these indicators with overarching business goals, organizations can move beyond guesswork and build a sustainable, data-driven engine for long-term growth. Successful optimization requires a disciplined approach to selecting the right numbers, protecting against unintended consequences with guardrails, and always viewing the data through the lens of the customer’s journey.