The digital economy has reached a point of saturation where marginal gains in user experience can translate into millions of dollars in incremental revenue. Consequently, A/B testing—the process of comparing two versions of a webpage or app against each other to determine which one performs better—has evolved from a niche marketing tactic into a core pillar of product development. However, the mere possession of A/B testing software does not guarantee success. The critical challenge for modern enterprises lies in the interpretation of results. Misreading a dashboard can lead to "false winners," where a company deploys a change that actually harms the long-term user experience, or "missed opportunities," where a transformative idea is discarded due to a lack of statistical nuance.
The Foundational Mechanics of A/B Test Calculation
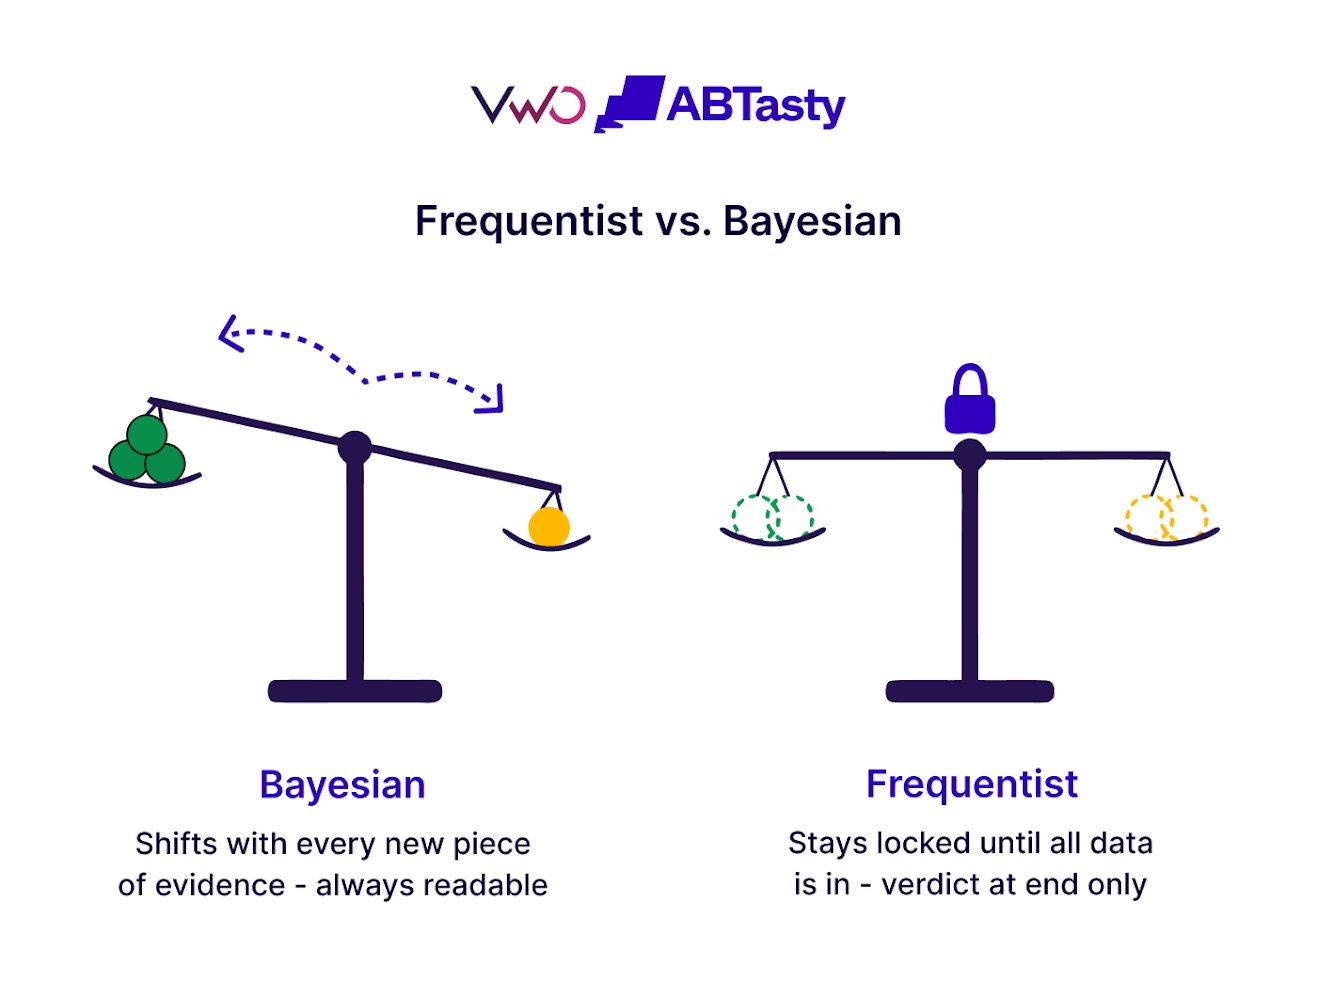
To interpret results effectively, one must first understand the mathematical engines driving the software. Most modern platforms utilize one of two statistical frameworks: Frequentist or Bayesian inference.
The Frequentist approach is the traditional method used in scientific research. It operates on the concept of the "null hypothesis," which assumes there is no difference between the control and the variation. The software calculates a p-value, which represents the probability of obtaining the observed results if the null hypothesis were true. A result is typically deemed "statistically significant" if the p-value is less than 0.05, meaning there is less than a 5% chance the observed lift is due to random noise.
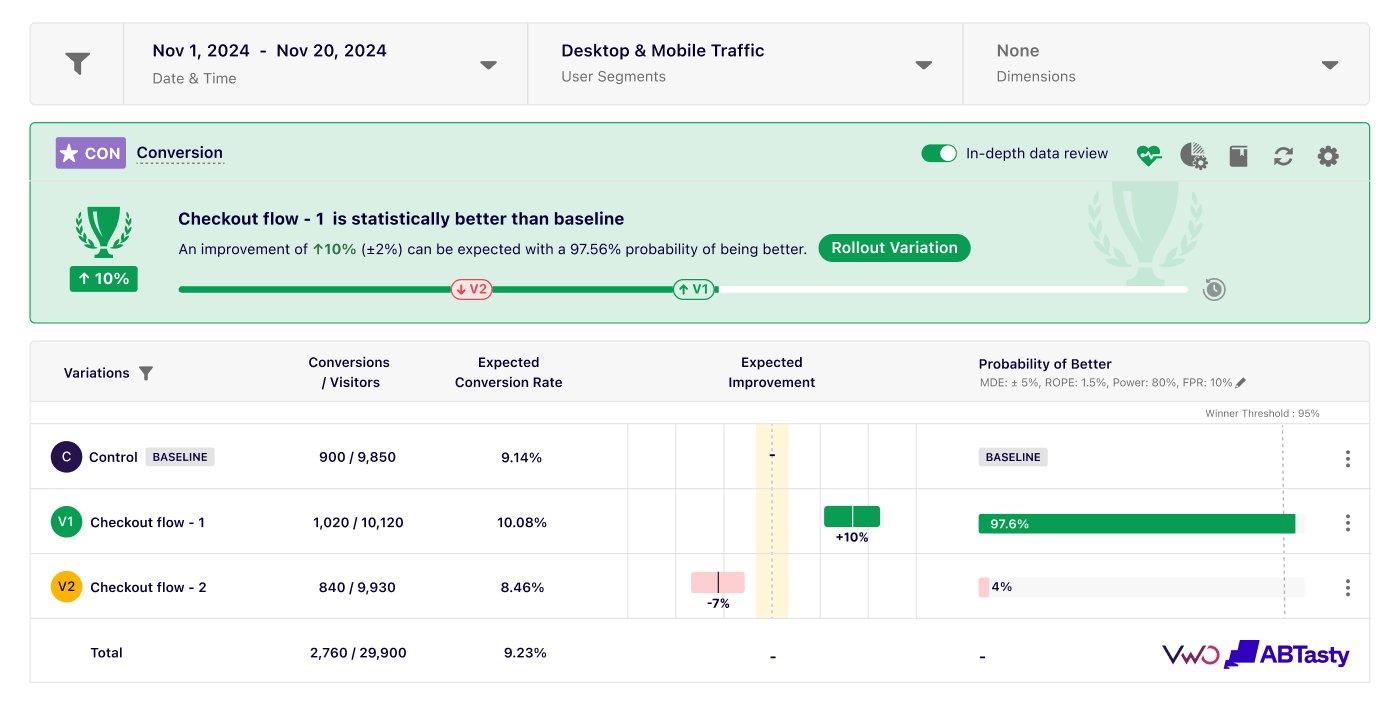
In contrast, the Bayesian approach, favored by platforms like VWO and GrowthBook, focuses on the "probability of being best." Instead of a binary significant/non-significant output, Bayesian models provide a continuous estimate of how likely it is that Variation B will outperform the Control. This model is often more intuitive for business stakeholders as it answers the direct question: "What is the chance that this change will make us more money?"
Understanding which model your software employs is vital. Frequentist models require a pre-determined sample size and are highly sensitive to "peeking"—the act of checking results early and stopping the test as soon as a significant result appears. Bayesian models are generally more robust for real-time decision-making but require a clear understanding of "prior" distributions and credible intervals.
A Chronological Framework for Result Validation
Interpreting results is not a singular event but a multi-stage process that must follow a rigorous chronology to ensure data integrity.
Phase 1: Temporal and Volumetric Stability
Before looking at conversion lifts, an analyst must confirm the test has reached two thresholds: duration and sample size. A test must run for at least one to two full business cycles (usually 7 to 14 days). This accounts for "day-of-the-week" effects; for instance, B2B users may behave differently on a Monday morning than on a Saturday afternoon. Stopping a test after three days because Variation B is "winning" often leads to regression to the mean once the full cycle is completed. Simultaneously, the sample size must be large enough to provide "statistical power," ensuring that the test can actually detect a difference if one exists.
Phase 2: Statistical Significance vs. Practical Significance
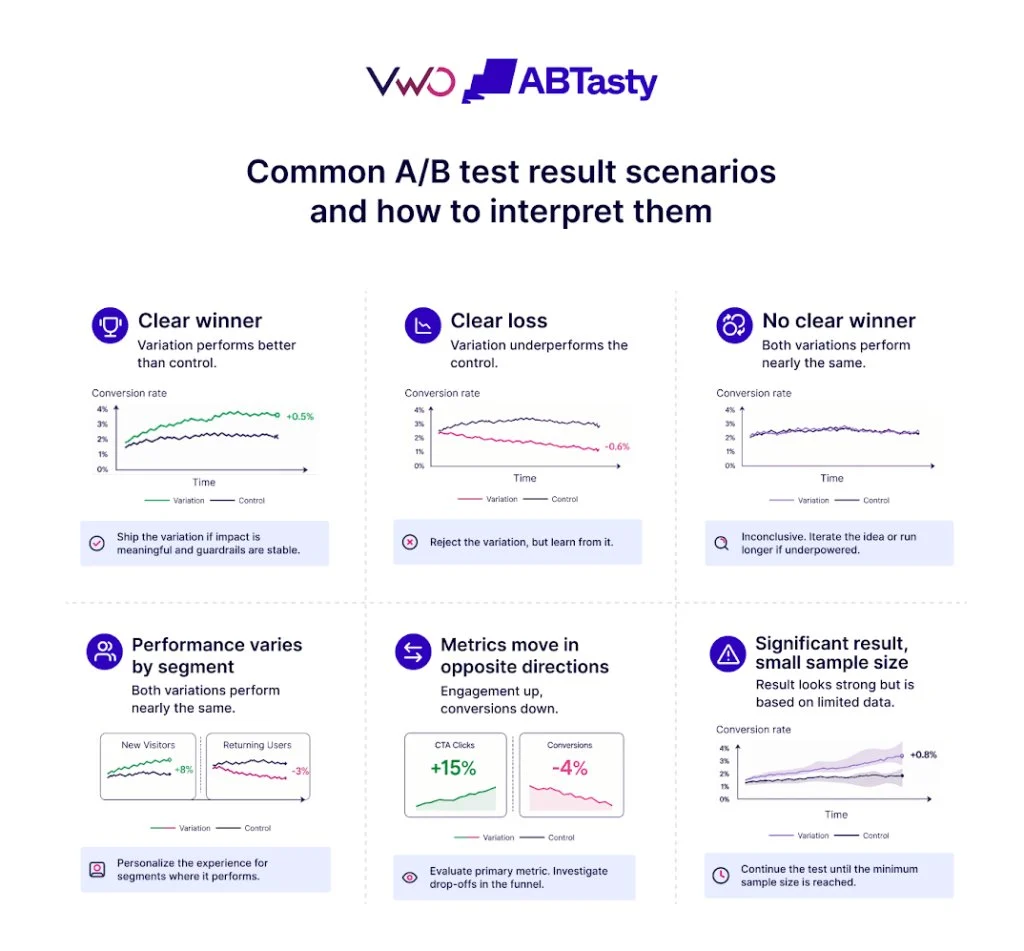
Once the temporal requirements are met, the software’s significance score must be validated. However, a "statistically significant" result is not always "practically significant." For example, a test might show a 0.1% lift in click-through rate with 99% confidence. While the data is reliable, the cost of implementing that change (engineering hours, maintenance) might outweigh the actual revenue gain. Professional interpretation requires translating percentage lifts into hard currency or primary business KPIs.
Phase 3: External Factor Audit
Analysts must investigate whether external anomalies coincided with the test period. Was there a massive seasonal sale? Did a competitor launch a major campaign? Was there a technical glitch on the site that affected only the Control group? External factors can create "noise" that software might mistake for a "signal."
The Multi-Metric Hierarchy: Success, Guardrail, and Diagnostic
A common mistake in A/B testing is focusing solely on a single "winning" metric. Comprehensive interpretation requires a three-tiered metric strategy:
- Success Metrics (Primary): The main goal, such as "Completed Purchases" or "Account Sign-ups."
- Guardrail Metrics (Counter-metrics): These ensure that the primary win doesn’t come at a hidden cost. For example, if an aggressive "Buy Now" button increases sales but also increases customer service complaints or refund requests, the test may actually be a net loss for the company.
- Diagnostic Metrics (Secondary): These help explain why a result happened. If purchases increased, did it happen because more people added items to the cart, or because the checkout form had fewer errors?
The "Lie of the Average" and the Power of Segmentation
Aggregate results can be profoundly misleading. A test might show a "flat" result—no difference between Control and Variation—while hiding significant wins in specific sub-groups. This phenomenon is known as Simpson’s Paradox.
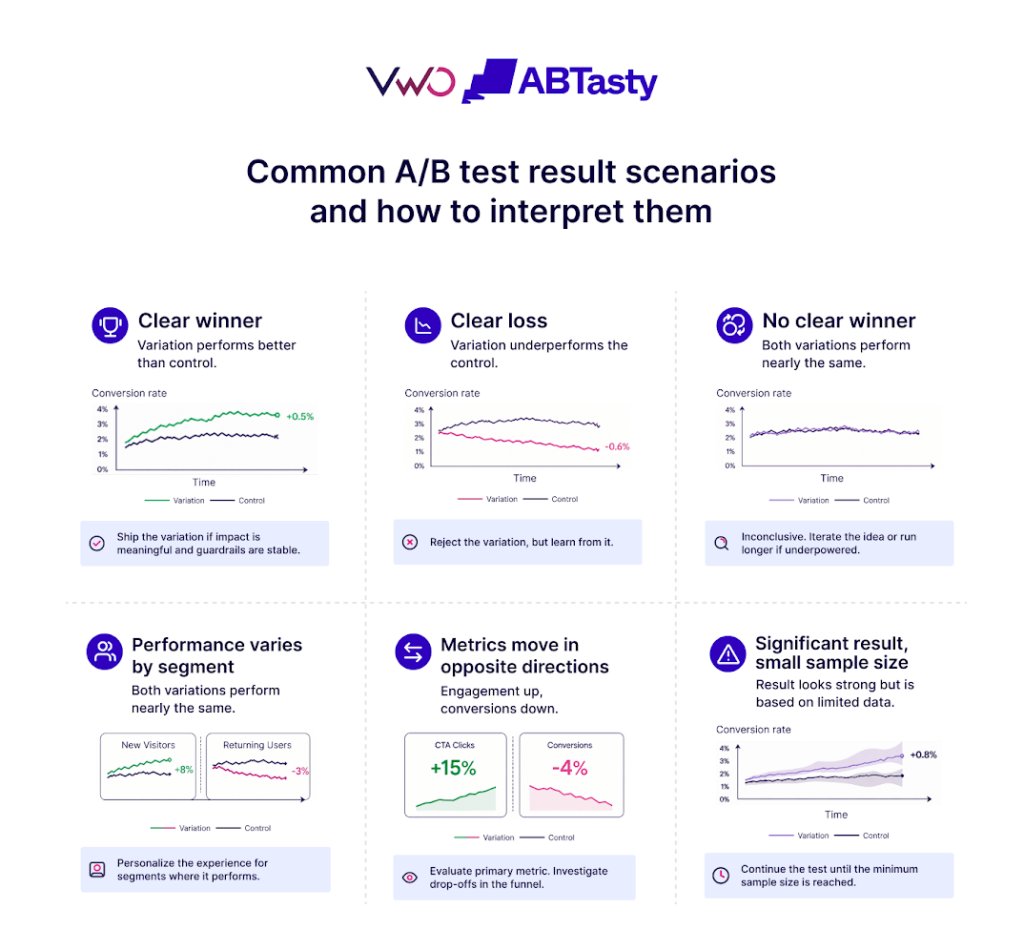
By segmenting the data, an analyst might discover that:
- Device Type: The variation was a massive winner on Desktop but failed on Mobile due to a rendering issue.
- Traffic Source: Direct visitors (loyalists) hated the change, but New Visitors (from PPC ads) converted at a much higher rate.
- User Type: Returning customers found the new navigation confusing, whereas new users found it intuitive.
Modern platforms like Optimizely and VWO allow for "post-hoc segmentation," enabling teams to find these hidden pockets of growth. However, experts warn against "data dredging"—searching through dozens of segments until you find one that looks positive by sheer luck. Segments should be prioritized based on pre-test hypotheses.
Behavioral Validation: Beyond the Numbers
While quantitative data (the "what") is provided by the A/B testing software, qualitative data (the "why") is often found in integrated behavioral tools. Leading practitioners now use heatmaps, scroll maps, and session recordings to validate their test results.

If a variation lost, a session recording might show that users were clicking on a non-clickable element or that a new pop-up obscured the "Checkout" button on smaller screens. This behavioral layer transforms a "failed test" into a "learning opportunity," providing the insights needed to iterate and launch a more successful Version 2.0.
Competitive Landscape: Software-Specific Interpretations
Different software packages offer unique features that influence how results are digested:
- VWO (Visual Website Optimizer): Uses a "SmartStats" engine that provides a "Probability to be Best" and a "Loss Aversion" metric, which tells the user how much they stand to lose if they deploy a variation that is actually inferior.
- Optimizely: Features a "Stats Engine" designed to solve the peeking problem, allowing users to check results at any time without inflating false positive rates.
- GrowthBook: An open-source alternative that connects directly to a company’s data warehouse (Snowflake, BigQuery), allowing for deeper custom analysis than most UI-based tools.
- Statsig: Popular among product engineering teams, it provides a "Scorecard" view that automatically tracks how a feature affects dozens of different metrics simultaneously.
Broader Impact and Ethical Implications
The shift toward rigorous A/B test interpretation has profound implications for the tech industry. It marks the decline of the "HiPPO" (Highest Paid Person’s Opinion) and the rise of a meritocratic, evidence-based culture. When companies interpret results correctly, they create more efficient, less frustrating user experiences.
However, there is an ethical dimension. A/B testing can be used to optimize "dark patterns"—design choices that trick users into spending more money or giving up more data than they intended. Responsible interpretation must involve an ethical check: is this "winner" providing genuine value to the user, or is it merely exploiting a psychological vulnerability?
Conclusion: Turning Data into Knowledge
The ultimate goal of A/B testing is not to find a "winner" but to build a repository of institutional knowledge. Every test—whether it is a clear win, a devastating loss, or an inconclusive flatline—contributes to the company’s understanding of its audience.
By following a structured approach—validating statistical models, running full business cycles, auditing for external factors, and layering in behavioral insights—organizations can move beyond "dashboard watching" and into the realm of true strategic experimentation. In an era where consumer preferences shift overnight, the ability to accurately interpret user behavior through software is perhaps the most valuable competitive advantage a business can possess.