Engagement rate stands as a pivotal social media metric, offering a quantifiable measure of how actively an audience interacts with a brand’s content. It transcends mere viewership or follower counts, delving into the depth of connection a piece of content, an entire campaign, or a social media account fosters relative to its reach or audience size. Unlike passive metrics such as impressions or views, engagement metrics capture deliberate actions users take to interact, signaling genuine interest and resonance. These actions can vary across platforms but broadly include likes, comments, shares, saves, poll responses, direct messages, and link clicks. Understanding the precise actions counted by each platform is crucial for accurate calculation and meaningful cross-channel performance comparisons.
The Evolving Landscape of Social Media Engagement
The ascendancy of engagement rate as a primary indicator of social media success is not arbitrary; it is a direct consequence of the dynamic evolution of social media algorithms. In the earlier days of social media marketing, follower count often served as a key vanity metric, mistakenly equated with influence or audience reach. However, as platforms like Facebook, Instagram, and TikTok matured, their algorithms shifted focus. Major updates, such as Facebook’s 2018 change prioritizing "meaningful interactions," fundamentally altered how content was distributed. No longer was a large follower base a guarantee of visibility. Instead, algorithms began to favor content that generated genuine interaction, pushing it to broader audiences. This algorithmic shift underscored the critical importance of engagement: it became the signal to platforms that content was valuable and relevant, deserving of wider distribution.

High engagement rates serve multiple strategic purposes. Firstly, they validate content efficacy, confirming that marketing messages resonate with the target audience. When users invest time to interact, it provides a strong qualitative signal of content utility or entertainment value. Secondly, as noted, robust engagement significantly enhances content visibility. Social algorithms are designed to surface popular and relevant content, meaning highly engaged posts are more likely to appear in users’ feeds and explore pages, extending organic reach beyond immediate followers. Thirdly, an active comment section or a high volume of shares can cultivate a sense of community and trust around a brand, making it more appealing to new profile visitors. For enterprise-level marketing teams, engagement rate is also a concrete metric for demonstrating social media return on investment (ROI) to leadership, directly linking content performance to tangible audience behavior.
Deconstructing Engagement: Metrics and Methodologies
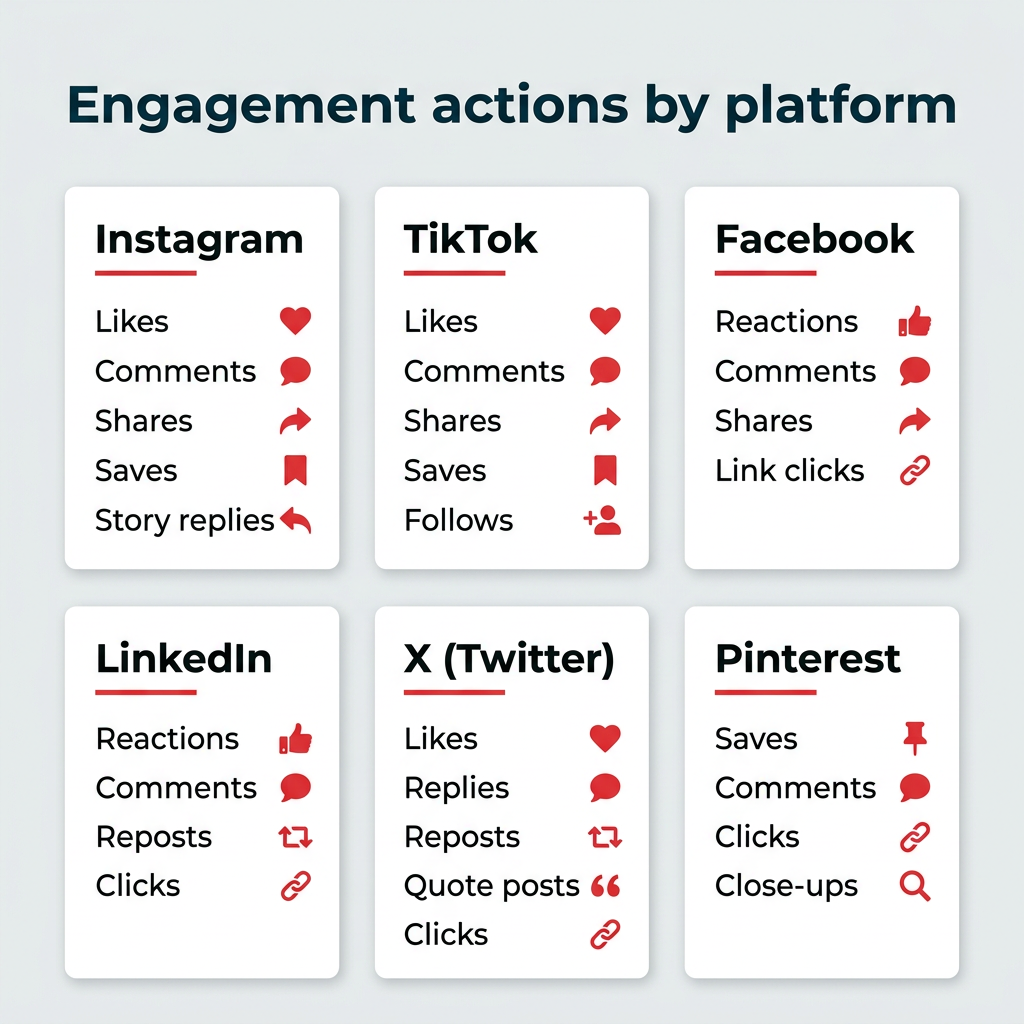
Defining what constitutes "engagement" can be nuanced, as each major social network employs its own specific criteria. While the general principle is user interaction, the granular details matter for precise measurement and comparative analysis. For instance, on Instagram, engagements might include likes, comments, saves, shares, and story interactions (e.g., sticker taps, replies). LinkedIn, being a professional network, often emphasizes comments, shares, reactions, and clicks on articles or profiles. TikTok, with its short-form video focus, counts likes, comments, shares, and saves, alongside watch time metrics. Twitter (now X) prioritizes likes, retweets, replies, and profile clicks. Understanding these platform-specific definitions is the first step toward calculating an accurate and actionable engagement rate. Passive metrics such as impressions (the number of times content is displayed) and views (especially short-duration video views) are generally excluded from direct engagement calculations because they indicate exposure rather than active interaction.
To precisely quantify this interaction, social media professionals utilize a range of formulas, each offering a distinct perspective on performance. The choice of formula depends heavily on the specific marketing objective and the type of content being evaluated. Hootsuite provides a free engagement rate calculator, a valuable tool for quickly assessing performance on a post-by-post basis, for an entire campaign, or over a defined period, across any social network. For more detailed analysis, dedicated social media analytics platforms like Perch by Hootsuite offer automated tracking and reporting, streamlining the data collection process for large teams.
Here are the six most common formulas for calculating social media engagement rates:
-
Engagement Rate by Reach (ERR): The Most Common Metric
ERR measures the percentage of unique individuals who engaged with your content after seeing it. It’s often considered a highly accurate metric for organic content as it accounts for the actual audience exposed to a post, rather than just your total follower count.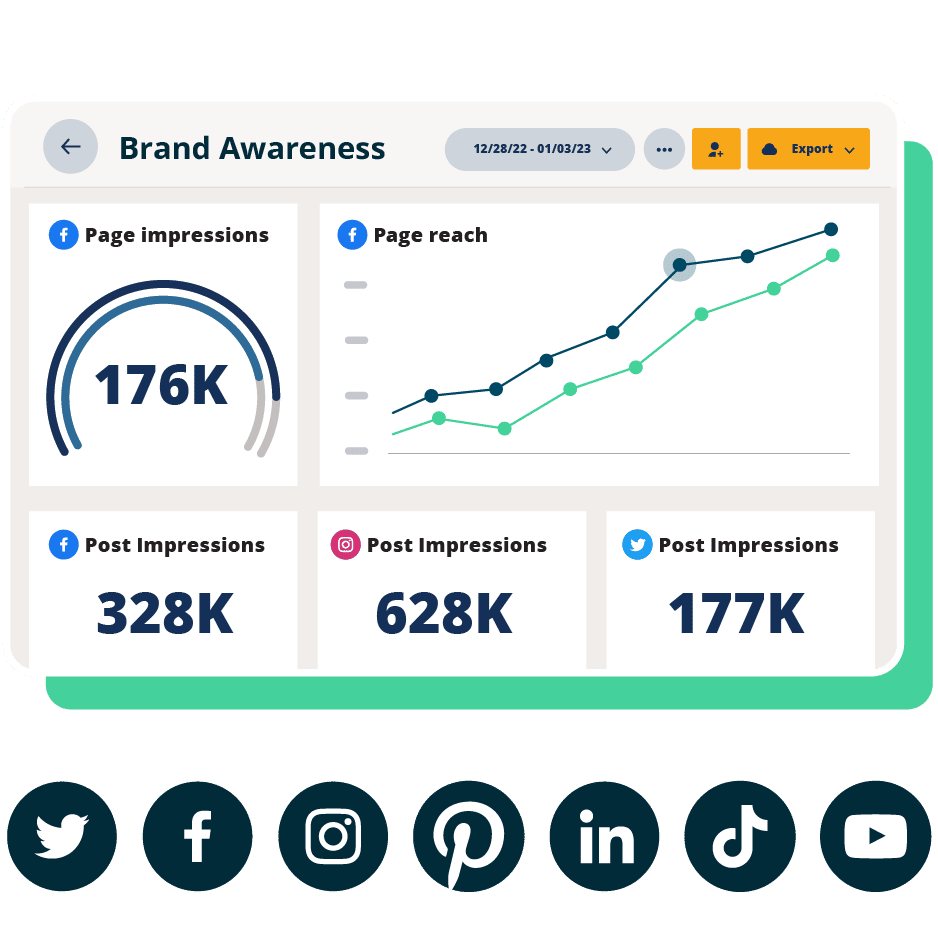
- Formula for a single post: ERR = (Total Engagements on a Post / Reach of that Post) * 100
- Average ERR across multiple posts: Average ERR = (Sum of ERR for Each Post / Number of Posts)
- Advantages: Provides a realistic view of how content performs with its actual audience. Reach includes both followers and non-followers, offering a broader performance indicator.
- Limitations: Reach can be a volatile metric, influenced by algorithmic changes, ad spend, and viral spread. A very low reach might inflate the ERR, while a high reach might dilute it, necessitating careful interpretation.
-
Engagement Rate by Post (ER Post): Ideal for Specific Post Comparison
ER post evaluates the engagement a post receives relative to your total follower count. This method is frequently favored by social media influencers and brands looking for a consistent baseline to compare the performance of individual content pieces.- Formula for a single post: ER Post = (Total Engagements on a Post / Total Followers) * 100
- Average ER Post across multiple posts: Average ER Post = (Sum of ER Post for Each Post / Number of Posts)
- Advantages: Offers a stable benchmark for comparing individual posts over time, as follower count is less volatile than reach.
- Limitations: Does not account for viral reach beyond your follower base, potentially underrepresenting the true impact of highly shareable content. This rate can also naturally decline as follower count grows, even if total engagements remain high.
-
Engagement Rate by Impressions (ER Impressions): Best for Paid Content
ER impressions measures engagements against the total number of times a post was displayed, including repeat views by the same user. This formula is particularly relevant for paid advertising campaigns where impressions (CPM – Cost Per Mille/Thousand Impressions) are a key billing metric.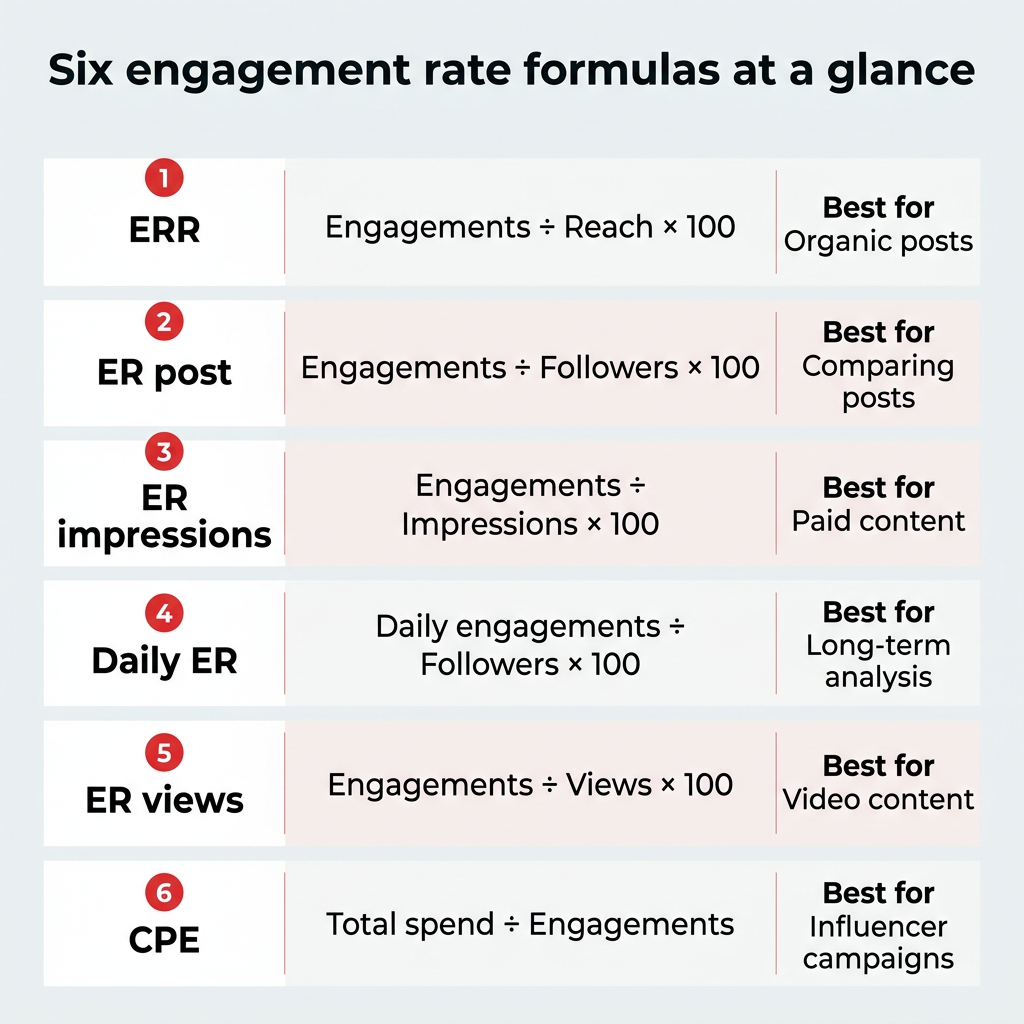
- Formula: ER Impressions = (Total Engagements on a Post / Total Impressions) * 100
- Average ER Impressions: Average ER Impressions = (Sum of ER Impressions for Each Post / Number of Posts)
- Advantages: Directly aligns with the cost structure of many paid social media campaigns, making it excellent for measuring ad effectiveness.
- Limitations: Generally yields lower engagement rates than ERR or ER Post because impressions inherently count multiple views by the same user who is unlikely to engage multiple times. Impressions, like reach, can also be inconsistent.
-
Daily Engagement Rate (Daily ER): For Long-Term Account Analysis
Daily ER assesses how frequently followers interact with an account on an average day, encompassing engagements on all posts, regardless of when they were published.- Formula: Daily ER = (Total Engagements in a Day / Total Followers) * 100
- Average Daily ER: Average Daily ER = (Total Engagements for X Days / (X * Total Followers)) * 100
- Advantages: Provides a holistic view of ongoing account activity, capturing engagements on older content discovered by new followers. This metric can be customized to focus on specific engagement types (e.g., daily comments).
- Limitations: Does not differentiate between one highly active follower and many less active ones. It can also fluctuate based on content publication volume, requiring contextual analysis.
-
Engagement Rate by Views (ER Views): Tailored for Video Content
ER views specifically measures the engagement generated by video content relative to its total view count.
- Formula: ER Views = (Total Engagements on Video Post / Total Video Views) * 100
- Average ER Views: Average ER Views = (Sum of ER Views for Each Video / Number of Videos)
- Advantages: Directly assesses the effectiveness of video content in stimulating interaction, a crucial metric given the dominance of video across platforms.
- Limitations: View counts often include repeat views from the same user, which can lead to a lower ER Views compared to other formulas.
-
Cost Per Engagement (CPE): For Influencer and Conversion Campaigns
CPE calculates the financial efficiency of engagement, showing the cost incurred for each user interaction generated by a campaign. It’s particularly valuable for performance marketing and influencer collaborations.- Formula: CPE = (Total Amount Spent / Total Engagements)
- Advantages: Provides a clear measure of budget efficiency for campaigns aiming to drive interaction. Most social ad platforms automate this calculation.
- Limitations: Requires a consistent definition of "engagement" across all tracked interactions to ensure accurate comparisons.
Navigating the 2026 Engagement Rate Benchmarks
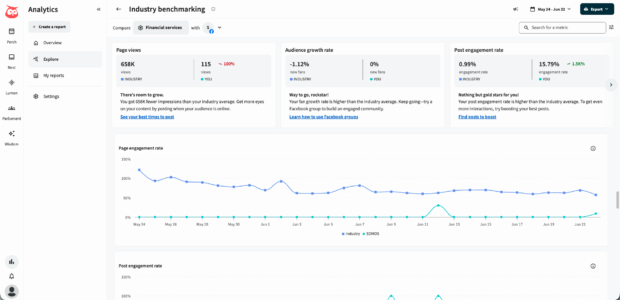
While a universally "good" engagement rate is often cited as falling between 1% and 5%, this range is highly dependent on various factors including the specific social media platform, the industry, audience size, and content type. Hootsuite’s collaborative analysis with data science agency Critical Truth, examining over one million social posts, provides crucial industry-specific benchmarks for 2026, enabling more precise strategic planning.
Overall Engagement Rate Benchmarks (All Industries):
- Instagram: 3%
- Instagram Reels: 2.7%
- LinkedIn: 2%
- X (Twitter): 1.8%
- TikTok: 1.5%
- Facebook: 0.8%
These figures reveal significant disparities across platforms. Instagram’s leadership at 3%, closely followed by Instagram Reels, highlights the power of visual and short-form video content in driving interaction. Instagram’s focus on aesthetics and direct audience interaction through features like stories and DMs contributes to its higher engagement. LinkedIn, as a professional network, maintains a respectable 2%, underscoring the value of professional networking and thought leadership content. X (Twitter) at 1.8% reflects its fast-paced, conversation-driven nature, where quick reactions are common. TikTok, despite its massive user base and viral potential, shows 1.5% engagement, potentially due to the sheer volume of content and the fleeting nature of trends. Facebook’s 0.8% often reflects its mature user base, the saturation of content, and its sophisticated algorithm that requires brands to work harder for organic visibility.
Sector-Specific Performance Analysis:
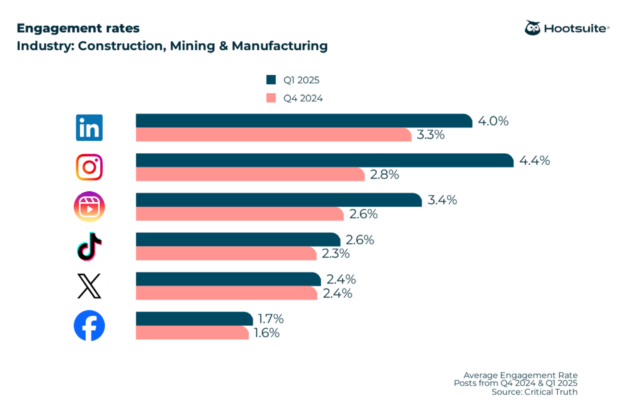
- Construction, Mining, and Manufacturing: This industry sees Instagram leading with 4.4%, demonstrating the effectiveness of visual content even in traditionally less "glamorous" sectors. Showcasing machinery, projects, and behind-the-scenes content resonates well. LinkedIn follows at 2.9%, underscoring its role in B2B networking and industry updates.
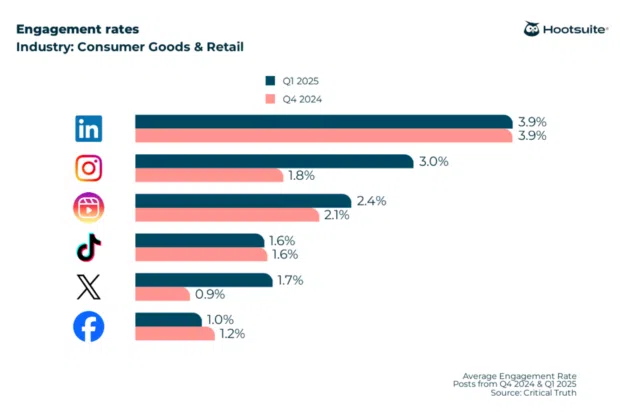
- Consumer Goods and Retail: LinkedIn surprisingly leads here at 3.9%, suggesting that professional connections and brand storytelling (B2B partnerships, corporate social responsibility) are highly engaging. Instagram, at 3.3%, remains critical for product showcase and lifestyle branding.
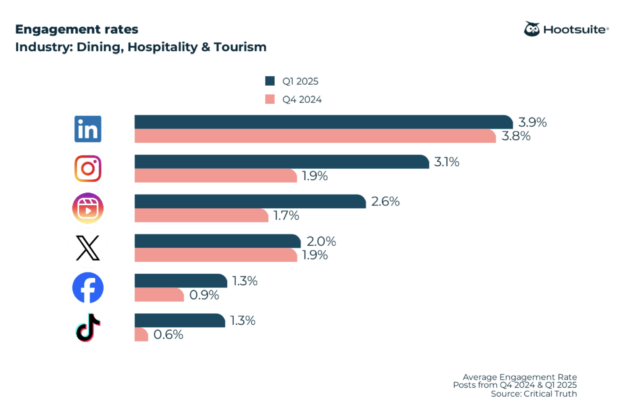
- Dining, Hospitality, and Tourism: Instagram and its Reels dominate this sector, with Instagram at 3.8% and Reels at 3.5%. This is intuitive, given the highly visual nature of food, travel, and experiences. High-quality imagery and video are paramount for evoking desire and encouraging bookings.
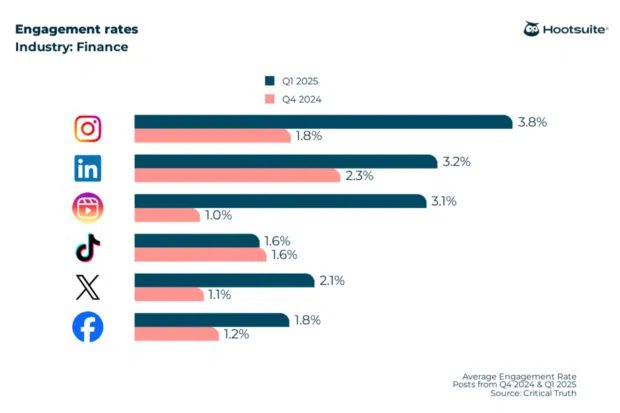
- Finance: Instagram again takes the lead at 3.8%, indicating that financial institutions can build trust and engagement through accessible, visually appealing content, demystifying complex topics, and showcasing company culture. LinkedIn follows closely at 3.1%, proving its worth for thought leadership and professional insights in a regulated industry.
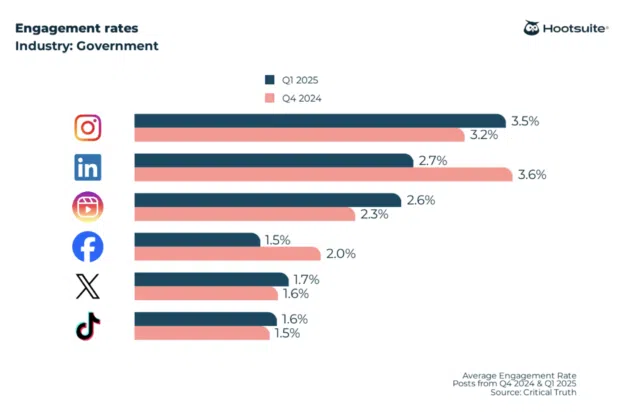
- Government: Government entities find strong engagement on Instagram (3.5%) and LinkedIn (2.9%). This suggests that transparent, informative, and visually engaging public announcements, alongside professional updates, are effective. Facebook at 1.1% also plays a significant role in community outreach.
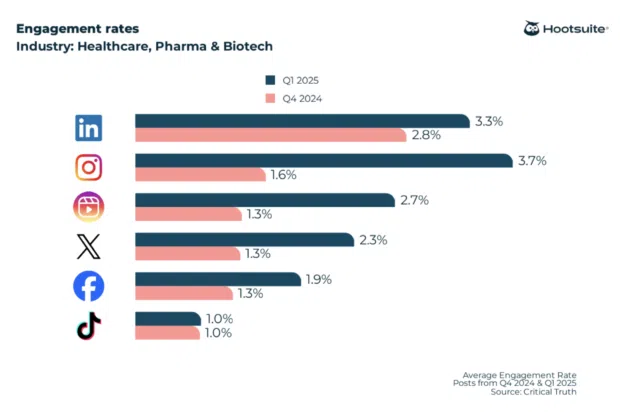
- Healthcare, Pharma, and Biotech: This sector also sees Instagram at the forefront with 3.7%, followed by LinkedIn at 3.1%. Visual health tips, patient stories (with consent), and professional medical insights perform well, bridging the gap between complex information and public understanding.
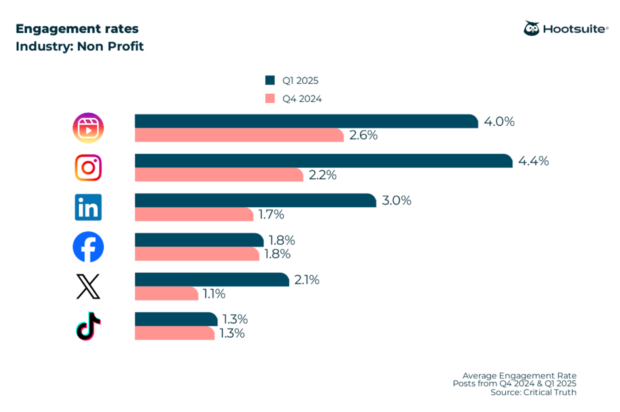
- Nonprofit: Nonprofits thrive on Instagram (4.4%) and Instagram Reels (3.5%), leveraging visual storytelling to convey impact, raise awareness, and mobilize support. Emotional appeals and success stories are particularly effective in this space. LinkedIn (3.2%) is also valuable for donor relations and partnerships.
These benchmarks highlight that while general ranges exist, true success is measured against industry and platform-specific performance. A 1% engagement rate might be excellent for a large brand on Facebook, but concerning for a small brand on Instagram.
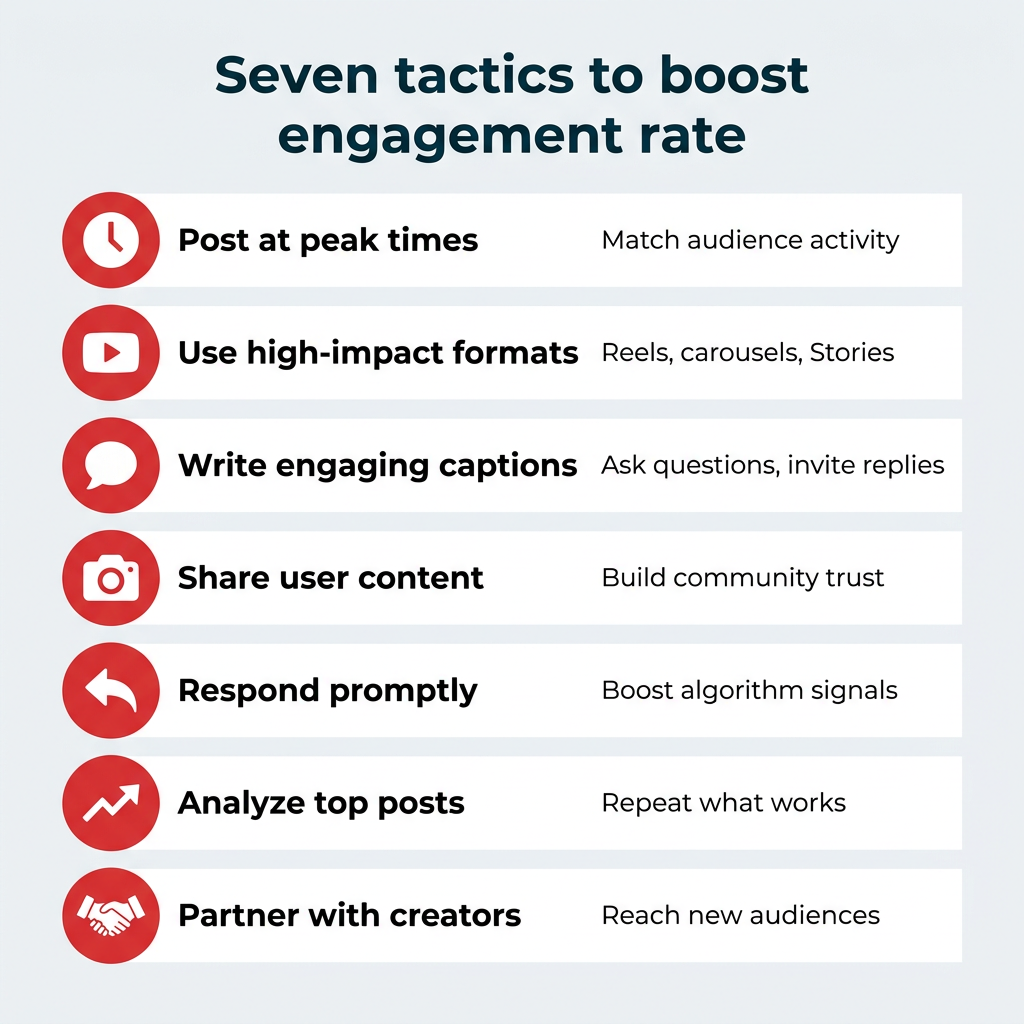
Strategic Imperatives: Boosting Your Engagement Rate
Improving engagement rate is a continuous process requiring strategic planning, content innovation, and consistent audience interaction. The most effective approach involves a data-driven feedback loop: analyze what works, double down on successful strategies, and refine areas of underperformance.
Here are practical tactics to enhance engagement:
-
Content Optimization for Platform and Audience:
- Experiment with Formats: Regularly test new content types such as Instagram Reels, carousels, interactive polls, quizzes, and live streams. Short-form video continues to dominate attention.
- Focus on Value: Create content that educates, entertains, inspires, or solves a problem for your audience. Content that sparks conversation or provides unique insights is highly engaging.
- High-Quality Visuals: Invest in professional-grade images and videos. Visually appealing content captures attention and encourages longer viewing times and interaction.
- Storytelling: Humanize your brand through authentic narratives, behind-the-scenes glimpses, and user-generated content. People connect with stories.
-
Audience-Centric Timing and Frequency:
- Analyze Peak Activity: Utilize analytics tools (like Perch by Hootsuite) to identify when your audience is most active and likely to engage. Scheduling posts during these peak times significantly increases visibility and interaction potential.
- Consistent Posting Schedule: Maintain a regular posting cadence without overwhelming your audience. Consistency builds anticipation and ensures your brand remains top-of-mind.
-
Proactive Community Management:
- Respond Promptly: Engage with comments, direct messages, and mentions quickly and authentically. This fosters a sense of being heard and valued.
- Ask Questions: Encourage dialogue by posing open-ended questions in your captions or stories.
- User-Generated Content (UGC): Actively seek out and reshare content created by your audience. This not only provides social proof but also makes your audience feel appreciated.
- Run Contests and Giveaways: These are powerful tools for driving immediate engagement, shares, and new followers.
-
Leveraging Interactive Features:
- Polls, Quizzes, and Q&As: Use Instagram Stories stickers, Facebook polls, or Twitter polls to encourage direct, low-effort interaction.
- Calls to Action (CTAs): Clearly guide your audience on what action you want them to take, whether it’s "Like this post if…", "Share your thoughts below," or "Click the link in bio."
-
Strategic Use of Hashtags and Keywords:
- Relevant Hashtags: Research and use a mix of popular, niche, and branded hashtags to increase discoverability and reach relevant audiences.
- SEO Optimization: For platforms like YouTube and Pinterest, optimize content with relevant keywords to appear in searches.
-
Cross-Promotion:
- Promote your social media content on other channels (e.g., email newsletters, website, other social platforms) to drive traffic and engagement.
-
A/B Testing and Continuous Learning:
- Regularly test different content types, posting times, caption lengths, and calls to action. Analyze the results to understand what resonates best with your specific audience and adapt your strategy accordingly.
Translating Data into Action: Implications for Social Strategy
Engagement rate data is not merely a reporting metric; it is an indispensable guide for shaping and refining your overall social media strategy. By consistently tracking trends over time and applying those insights, businesses can make informed decisions regarding content planning, resource allocation, and proving ROI.
- Refining Content Strategy: Analyzing which content formats, topics, and styles consistently yield high engagement provides a clear roadmap for future content creation. If Reels consistently outperform static images, allocate more resources to video production. If specific educational topics resonate, create more deep-dive content in that area.
- Informing Budget Allocation: Understanding the CPE for various campaigns allows marketers to optimize ad spend, directing resources towards campaigns that deliver the most cost-effective interactions. This is crucial for maximizing the efficiency of paid social efforts.
- Deepening Audience Understanding: Engagement data offers granular insights into audience preferences, pain points, and interests. The comments, shares, and saves reveal what truly matters to your community, allowing for more personalized and relevant communication.
- Competitive Analysis and Benchmarking: Comparing your engagement rates against industry benchmarks and competitors provides a realistic assessment of your performance. It can highlight areas where you excel or where you need to improve, offering strategic advantages.
- Proving Social Media ROI: For enterprise teams, engagement rate is a powerful metric to demonstrate the tangible value of social media efforts to stakeholders. By linking engagement to broader business objectives – such as brand awareness, lead generation, or customer loyalty – marketers can clearly illustrate the impact of their strategies.
Ultimately, engagement rate serves as a barometer of brand health and algorithmic favorability in the ever-evolving digital landscape. It transcends the superficiality of follower counts, offering a profound insight into the genuine connection between a brand and its audience. As social media continues to evolve, the ability to cultivate and measure meaningful engagement will remain central to achieving sustained digital success and driving measurable business outcomes. Regular monitoring, strategic adaptation, and a deep understanding of platform nuances are paramount for any entity striving for impactful social media presence.